Which Streaming Service Has the Most Viewers? (Q4 2025)
slug: most-watched-streaming-service-q4-2025 · status: draft · score: 80% · 1 versions
View published version → · Contentful entry: 4BUha5zuSYBkZJ6SIA6kGl
Validation
| Rule | Detail | |
|---|---|---|
| pass | No banned competitors | No banned competitors |
| pass | No emdashes | No emdashes |
| warn | Avoid AI telltale words | AI telltale words found: landscape, comprehensive |
| pass | Primary keyword in title | No primary keyword to check |
| pass | Use contractions | Contractions used |
| fail | Minimum internal links | Internal links not in sitemap: /resources/streaming-tv-ad-cost, /resources/tv-advertising-for-small-business, /how-it-works, /resources/what-is-connected-tv-advertising, /how-it-works, /pricing |
| pass | FAQ section required | FAQ section present |
| fail | Author assigned | No author assigned (never use 'Adwave Team' for new content) |
| pass | Title length 50-60 | Title length 55 |
| pass | Minimum 4 images | 6 images |
| pass | SEO description under 160 | seoDescription 160 chars |
| pass | Adwave mention cadence | 5 Adwave mentions |
| pass | Short description present | shortDescription 211 chars |
| warn | Word count by type | Word count 3095 well above target (1500-2500) |
| warn | Year-dated title for evergreen types | Year-dated type should include (2026) in the title |
| pass | No manual table of contents | No manual TOC |
Images (6)
Content
Which Streaming Service Has the Most Viewers? (Q4 2025)
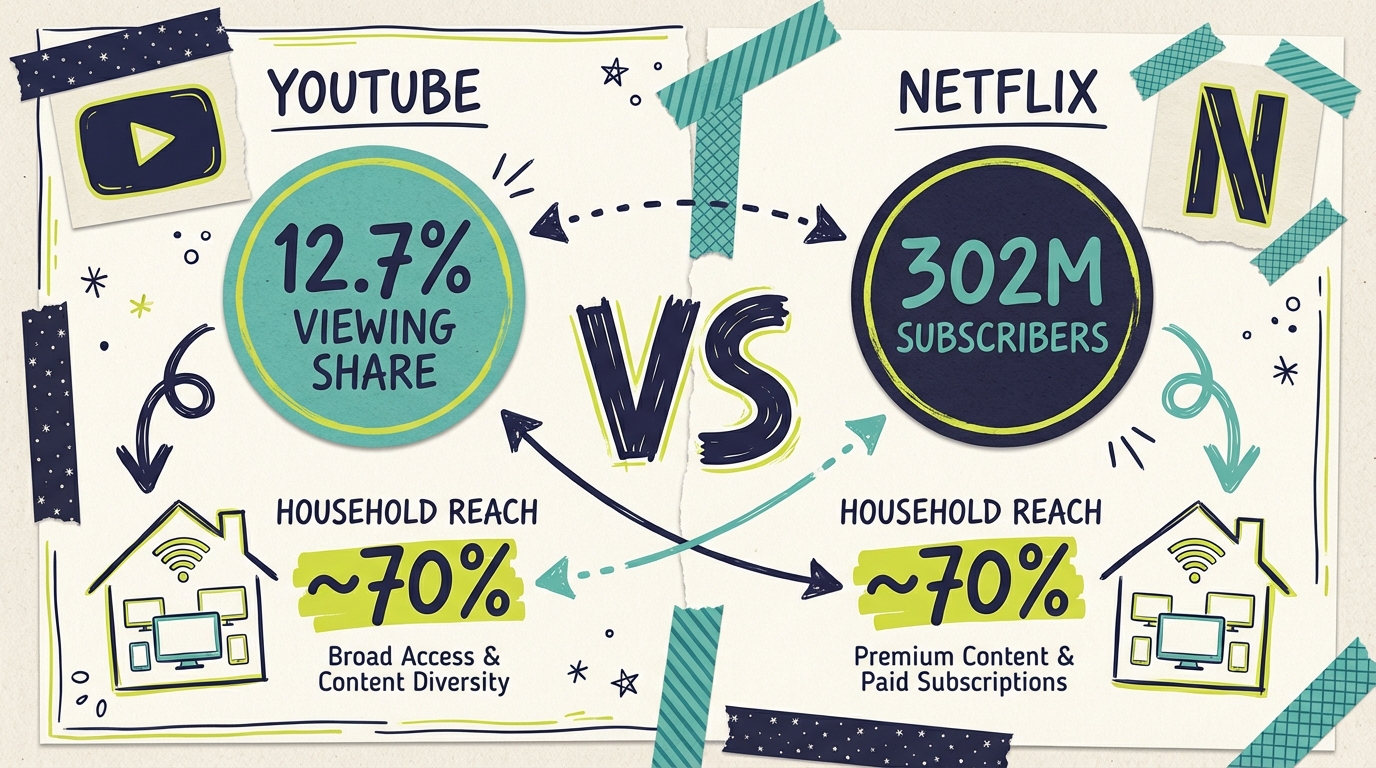
YouTube remains the most-watched streaming service in the United States, commanding 12.7% of total TV viewing time in December 2025, according to Nielsen's Gauge. Netflix followed with a record 9.0% share, while Amazon Prime Video surged to 4.3%, also setting a new platform high. Together, YouTube and Netflix now account for over 21% of all television viewing in America. For advertisers deciding where to allocate TV budgets, understanding which platforms dominate viewership is essential for reaching the right audiences.
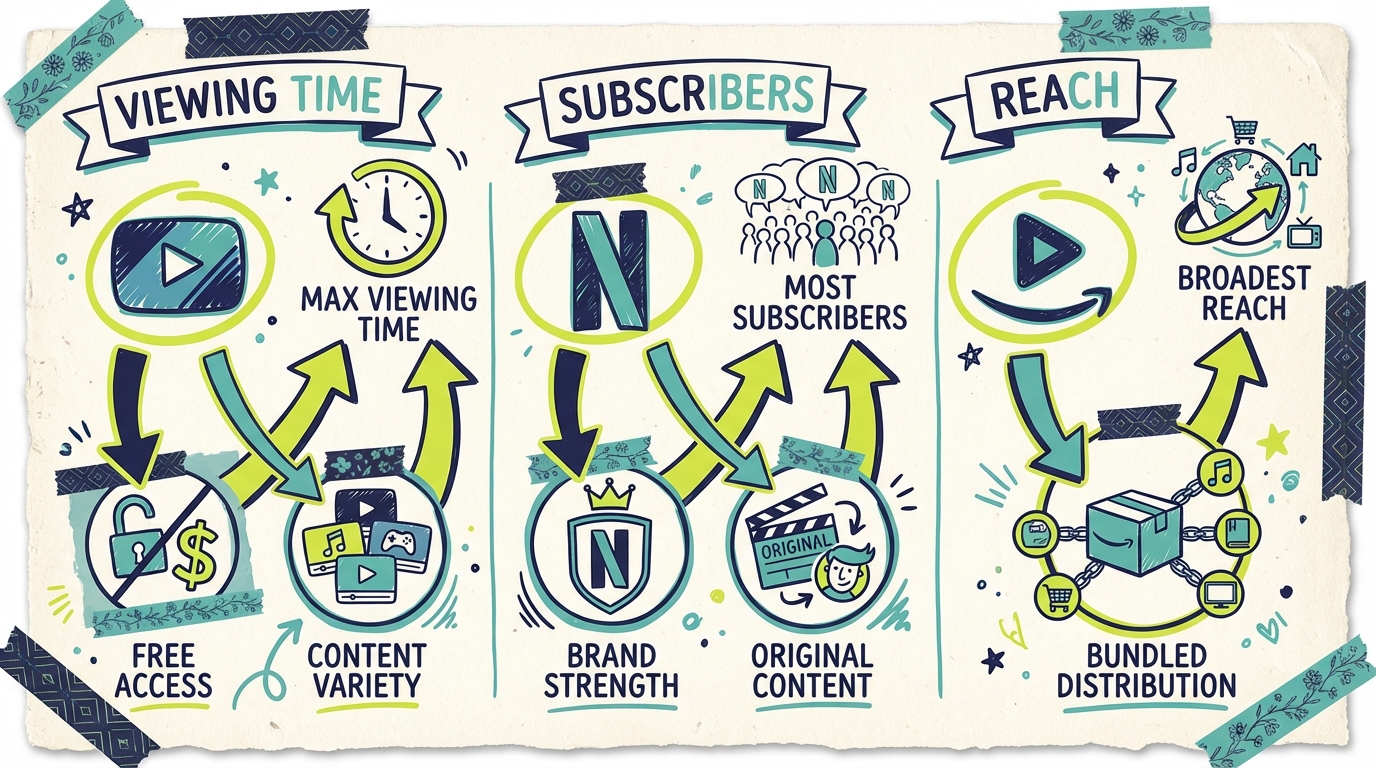
The answer to "which streaming service has the most viewers" depends on what metric you're measuring. YouTube leads in viewing time on television screens, but Netflix leads in global paid subscribers with over 300 million. Amazon Prime Video reaches more households than almost any service due to its Prime membership bundling. Each metric tells a different story about the streaming landscape, and advertisers benefit from understanding all of them.
---
What the data shows
December 2025 was a record-breaking month for streaming, with multiple platforms achieving their highest shares ever recorded.
Share of total U.S. TV viewing (Nielsen, December 2025)
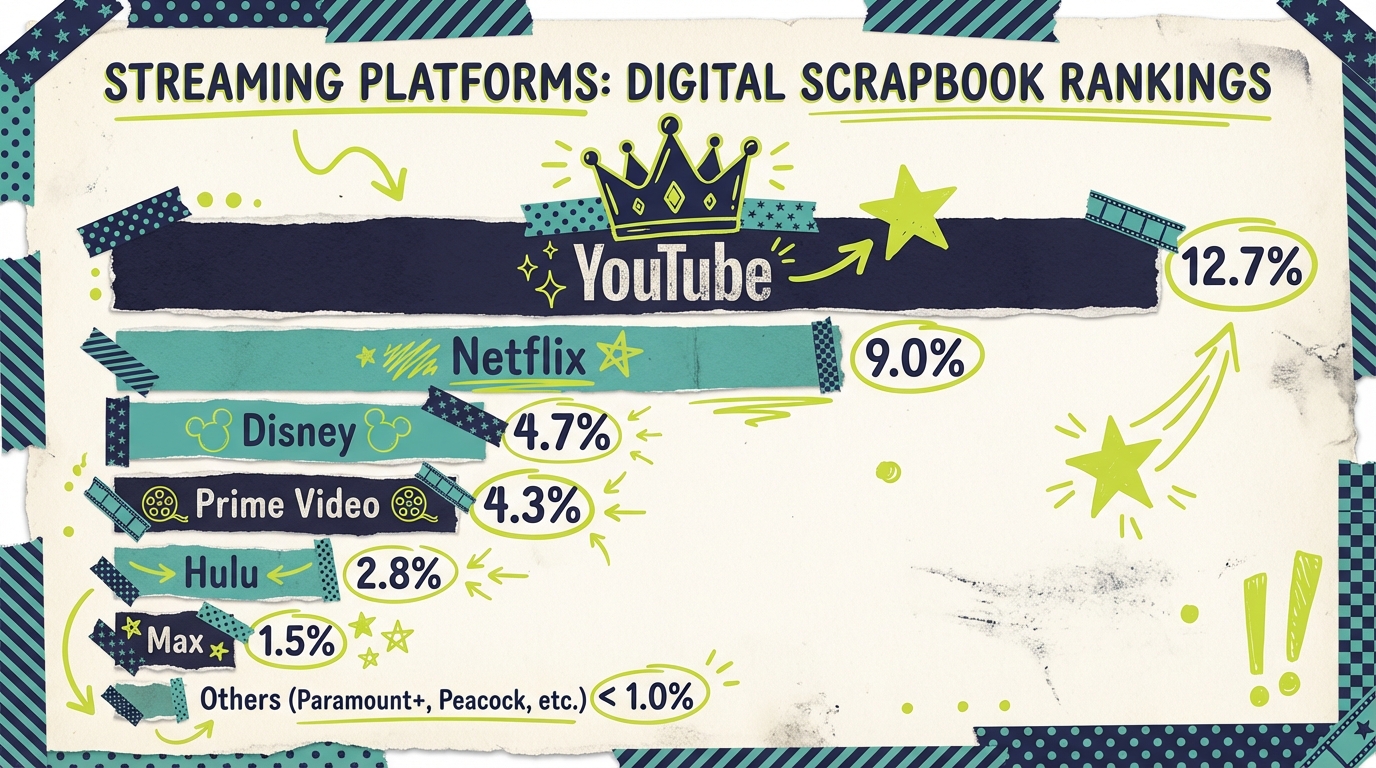
According to Nielsen's Gauge and industry reporting, here's how streaming platforms ranked by share of total television viewing:
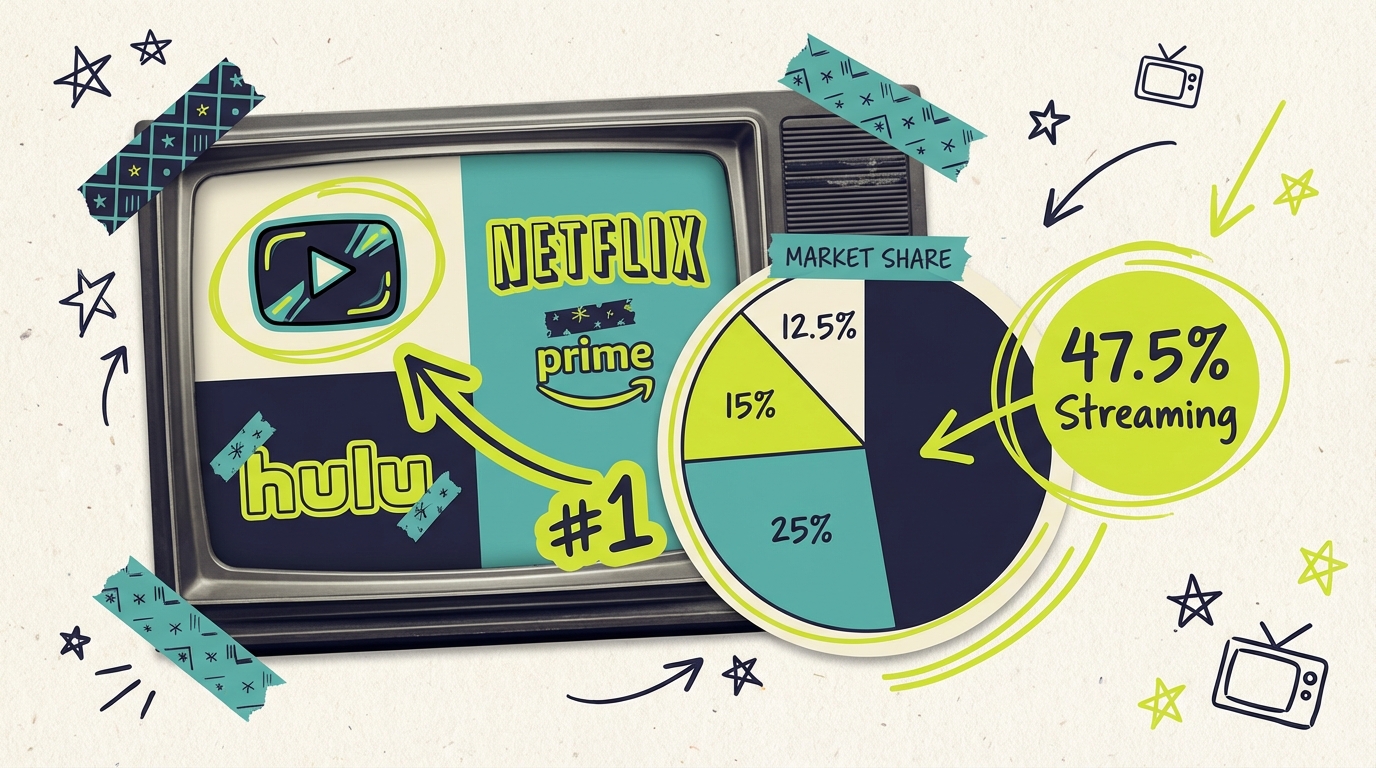
- YouTube: 12.7% (maintains No. 1 position for 8+ consecutive months)
- Netflix: 9.0% (up 10% month-over-month, new platform record)
- Disney (combined): 4.7% (Hulu + Disney+ combined share)
- Prime Video: 4.3% (surged 12% vs. November, new platform record)
- Roku Channel: 3.0% (new all-time high)
- Paramount Streaming: 2.5% (Paramount+ and Pluto TV combined, up 10%)
- Tubi: 2.0% (free ad-supported streaming service)
- Max: 1.8% (Warner Bros. Discovery's streaming service)
- Peacock: 1.7% (NBCUniversal's streaming platform)
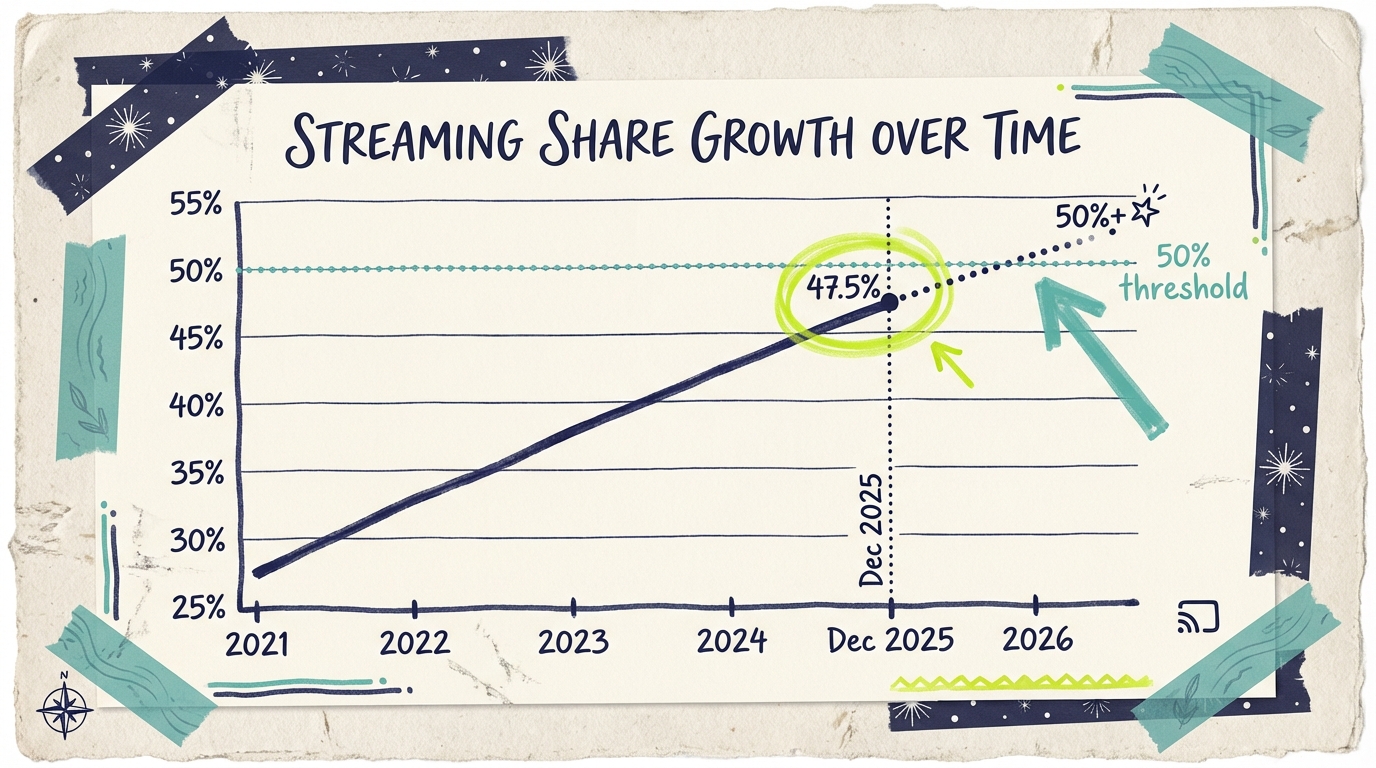
To put these numbers in perspective, streaming reached a historic milestone in December 2025, representing 47.5% of all TV viewing. This is the highest streaming share ever recorded in Nielsen's Gauge history. Streaming alone now exceeds the combined viewership of broadcast (21.4%) and cable (20.2%).
The gap between YouTube (12.7%) and Netflix (9.0%) represents a 3.7-point lead. YouTube's dominance is even more impressive considering that Nielsen only measures viewership on television screens, while YouTube likely captures an even larger share across mobile devices and computers.
December records
Four streaming platforms achieved their highest-ever shares in December 2025:
- Netflix hit 9.0%, driven by the final season of Stranger Things which generated over 15 billion viewing minutes
- Prime Video reached 4.3%, boosted by NFL Thursday Night Football and the Fallout series
- Roku Channel hit 3.0%, its all-time monthly high
- Paramount Streaming reached 2.5%, benefiting from holiday content
Year-over-year comparison
The acceleration from December 2024 to December 2025 shows streaming's continued growth:
Global subscriber counts
By paid subscriber count, the rankings look different:
- Netflix: 302+ million global subscribers (Q4 2025)
- Amazon Prime Video: 200+ million estimated (bundled with Prime membership)
- Disney+: 157 million subscribers globally (includes ad-supported)
- Max: 110+ million subscribers
- Paramount+: 72 million subscribers
- Peacock: 36 million paid subscribers
Netflix's subscriber leadership reflects its global reach across 190+ countries and its status as a pure subscription service. Amazon's numbers are complicated since Prime Video access comes bundled with Amazon Prime membership for shipping and other benefits.
Household reach
By U.S. household penetration:
- Netflix: 72% of U.S. households
- YouTube: 68% of U.S. households
- Amazon Prime Video: 67% of U.S. households
- Hulu: 36% of U.S. households
- Disney+: 34% of U.S. households
Netflix's high household reach combined with lower viewing share than YouTube suggests its subscribers watch less frequently, likely due to YouTube's free model encouraging more casual viewing sessions throughout the day.
---
Breaking down the numbers
Understanding why different platforms lead in different metrics helps advertisers make better targeting decisions.
Why YouTube leads in viewing time
YouTube's dominance in viewing share stems from several factors. First, its free, ad-supported model eliminates the subscription barrier that limits other platforms' reach. Anyone with internet access can watch YouTube without payment commitment.
Second, YouTube's content breadth is unmatched. The platform hosts everything from 30-second clips to full-length movies, music videos to educational content, creator vlogs to professional productions. This variety keeps users coming back throughout the day for different content needs.
Third, YouTube has successfully transitioned to the television screen. While traditionally associated with phones and computers, YouTube is increasingly consumed on TVs through smart TV apps, Roku, Amazon Fire TV, and other devices. This living room presence puts YouTube in direct competition with traditional streaming services.
Fourth, YouTube's recommendation algorithm excels at keeping viewers engaged. Research from Nielsen shows that daytime YouTube viewing has grown significantly, with average daytime audiences reaching 6.3 million viewers. When people have nothing else to watch, they turn to YouTube first.
Why Netflix leads in subscribers
Netflix's subscriber leadership reflects different strengths. The platform pioneered subscription streaming and has the strongest brand recognition in the category. When people think "streaming service," Netflix often comes to mind first.
Netflix's content investment creates appointment viewing. When a major Netflix original launches, subscribers log in specifically to watch it. This differs from YouTube's more casual, browse-and-discover viewing pattern. In December 2025, the final season of Stranger Things drove massive viewership, generating over 15 billion viewing minutes.
Netflix's ad-supported tier has been a significant success since launching in late 2022. The lower-priced option at $6.99/month has attracted price-sensitive subscribers while opening premium advertising inventory. Over 70 million monthly active users now watch Netflix with ads, representing about 40% of new signups.
The Disney bundle effect
Disney's combined 4.7% share includes both Hulu and Disney+. Disney has merged these apps into a unified experience, creating a more streamlined viewing option that combines general entertainment (Hulu) with family and franchise content (Disney+).
Hulu's live TV offering contributes to its viewing share by including traditional broadcast and cable programming. This hybrid model bridges streaming and traditional TV in ways pure streaming services don't. Disney's combined ad-supported reach across Hulu and Disney+ exceeds 157 million viewers globally.
Amazon's bundled advantage
Amazon Prime Video's surge to 4.3% in December reflects both content strength and distribution advantages. Prime Video benefits from bundling with Amazon Prime membership, giving it automatic access to over 200 million potential viewers. Many Prime subscribers have video access without actively choosing it.
December's record was driven by NFL Thursday Night Football games and the continued success of shows like Fallout. Amazon's 2024 introduction of ads to the base Prime Video tier significantly expanded available advertising inventory. Approximately 115 million U.S. viewers now see ads on Prime Video each month.
The rise of free ad-supported streaming
Free ad-supported streaming television (FAST) services continue growing. Roku Channel's climb to 3.0% demonstrates that ad-supported models can attract significant audiences. Tubi at 2.0% and Pluto TV (included in Paramount's 2.5%) show similar strength.
For advertisers, FAST services often offer lower CPMs than premium subscription services while still delivering engaged, living-room viewing audiences. The growth of these platforms creates additional inventory for streaming TV advertising.
---
Why it matters for your business
Understanding streaming platform rankings helps businesses allocate advertising budgets effectively, but the insights extend beyond simple "advertise on the biggest platform" logic.
Reach versus environment
YouTube's largest reach doesn't automatically make it the best advertising option for every business. YouTube's content environment is more varied and includes user-generated content alongside professional productions. Netflix and premium streaming services offer more controlled, "premium" environments that some advertisers prefer.
Consider your brand positioning. A luxury brand might value Netflix's premium perception over YouTube's broader reach. A startup seeking maximum exposure might prioritize reach over environment. Both approaches can work depending on your specific goals.
Audience composition differences
Different platforms attract different demographics. YouTube skews younger and includes more male viewers. Netflix has broader demographic appeal across age groups. Hulu's live TV component attracts sports viewers. Amazon Prime Video correlates with higher household income due to Prime membership costs.
For businesses targeting specific demographics, platform selection matters. A business targeting young adults might weight YouTube more heavily, while one targeting affluent households might prioritize Amazon Prime Video.
The aggregation advantage
Most small businesses don't need to choose a single platform. Services like Adwave aggregate inventory across 100+ streaming channels, including YouTube, Netflix, Hulu, Amazon, and many others. This approach provides broad reach while letting algorithmic optimization find your best-performing placements.
For small business TV advertising, aggregated platforms often deliver better results than betting on a single service. You benefit from each platform's unique audience while the platform handles optimization.
Cost efficiency comparison
While CPMs vary, the total equation depends on your target audience. Paying $35 CPM on Netflix to reach engaged premium viewers may deliver better ROI than $15 CPM on a FAST service for brands seeking premium positioning.
---
How to take advantage of this trend
The streaming landscape's fragmentation creates both challenge and opportunity for advertisers.
Start with aggregated access
Unless you have strong reason to target a specific platform, begin with aggregated access through services that provide reach across multiple streaming services. This approach provides broad reach while gathering data about which platforms perform best for your specific business.
Platforms like Adwave offer access to YouTube, Netflix, Hulu, Peacock, and 100+ other channels with campaigns starting at $50. This low barrier to entry enables testing before committing larger budgets to specific platforms.
Let data guide platform allocation
After initial campaigns, analyze which platforms drive results. Some businesses find YouTube delivers their best cost-per-acquisition despite its broader audience. Others discover premium environments like Netflix convert better despite higher CPMs.
Your data will likely differ from industry averages because your product, messaging, and target audience create unique dynamics. Resist the temptation to assume the "biggest" platform is automatically best for you.
Consider the full funnel
Different platforms may serve different funnel stages. Broad-reach platforms like YouTube excel at awareness building. Premium environments like Netflix may better support consideration and brand building. Understanding where each platform fits your customer journey enables more strategic allocation.
For businesses with limited budgets, aggregated platforms handle this optimization automatically. For larger advertisers with more resources, platform-specific strategies can unlock additional value.
Timing considerations
Viewing patterns shift seasonally and with content releases. Major streaming releases (like new seasons of popular shows) capture heightened engagement. Sports seasons boost platforms with live programming. Holiday periods see viewership spikes across all platforms.
Smart advertisers adjust platform allocation based on these patterns. December 2025's records were driven partly by holiday viewing, NFL football, and major releases like Stranger Things.
---
The bigger picture
Streaming's growth represents a permanent shift in media consumption, not a temporary trend. Understanding this context helps businesses plan long-term advertising strategies.
Streaming dominance is permanent
Viewers aren't returning to traditional cable. The 47.5% streaming share represents a structural shift in how Americans watch television. Younger generations who grew up with streaming will carry these habits throughout their lives, further cementing streaming's dominance.
For advertisers, this means CTV advertising skills are no longer optional. Understanding how to reach streaming audiences is a core marketing competency for any business that uses television advertising.
The 50% threshold approaches
Industry analysts project streaming will cross 50% of total TV viewing by mid-2026. December 2025 already saw two individual days exceed 50% (December 13 at 50.4% and Christmas Day at 54%). When streaming crosses 50% monthly, it will be the majority of television viewing, not just the largest category.
YouTube and Netflix will continue leading
YouTube and Netflix will likely continue leading their respective categories. YouTube's free model and content breadth make it difficult to displace from viewing time leadership. Netflix's brand, content investment, and global reach sustain its subscriber leadership.
Both platforms represent essential parts of any comprehensive streaming advertising strategy. The question isn't which one to choose but how to balance investment across both (and other platforms) based on your specific goals.
---
What experts are saying
Industry observers have noted the significance of December's record-breaking results.
Nielsen's Gauge report highlighted that "streaming shatters multiple records" and emphasized the historic nature of achieving 47.5% share. The research firm noted that four streaming platforms achieved personal-best shares in the same month.
Advanced Television's analysis observed that YouTube maintained its dominant position despite strong competition, noting that YouTube's lead over Netflix has remained consistent throughout 2025.
Industry research has shown that YouTube's daytime viewing continues to grow, with average audiences reaching 6.3 million viewers during daytime hours. When viewers have nothing else to watch, they increasingly turn to YouTube first.
---
Common questions answered
Which streaming service has the most viewers in 2025?
YouTube is the most-watched streaming service in the United States with 12.7% of total TV viewing time in December 2025, according to Nielsen. Netflix follows at 9.0%, with Disney's combined platforms (Hulu and Disney+) at 4.7%. YouTube has maintained the top position for eight consecutive months and continues to widen its lead over competitors.
How does YouTube compare to Netflix in viewership?
YouTube leads Netflix by 3.7 percentage points in TV viewing share (12.7% vs. 9.0% in December 2025). However, Netflix leads in global subscribers (302 million vs. YouTube's free model) and arguably offers a more premium advertising environment. Both platforms are valuable for advertisers but serve different strategic purposes.
What percentage of TV viewing is streaming?
Streaming represents 47.5% of all U.S. TV viewing as of December 2025, according to Nielsen. This is a record high and exceeds the combined viewership of broadcast (21.4%) and cable (20.2%). The streaming share has grown consistently and is expected to cross 50% by mid-2026.
Why is YouTube the most watched streaming service?
YouTube's dominance stems from its free access model, unmatched content variety, effective recommendation algorithm, and successful transition to television screens. Unlike subscription services, YouTube has no payment barrier, which maximizes reach. Its diverse content library keeps viewers returning throughout the day for different needs, from music to news to entertainment.
Can small businesses advertise on YouTube and Netflix?
Yes, small businesses can reach YouTube and Netflix viewers through aggregated CTV platforms like Adwave, which provide access to 100+ streaming channels including these major services. While direct advertising with these platforms may require larger budgets, aggregated access starts at just $50, making streaming TV advertising accessible to businesses of all sizes.
Which platform should I advertise on?
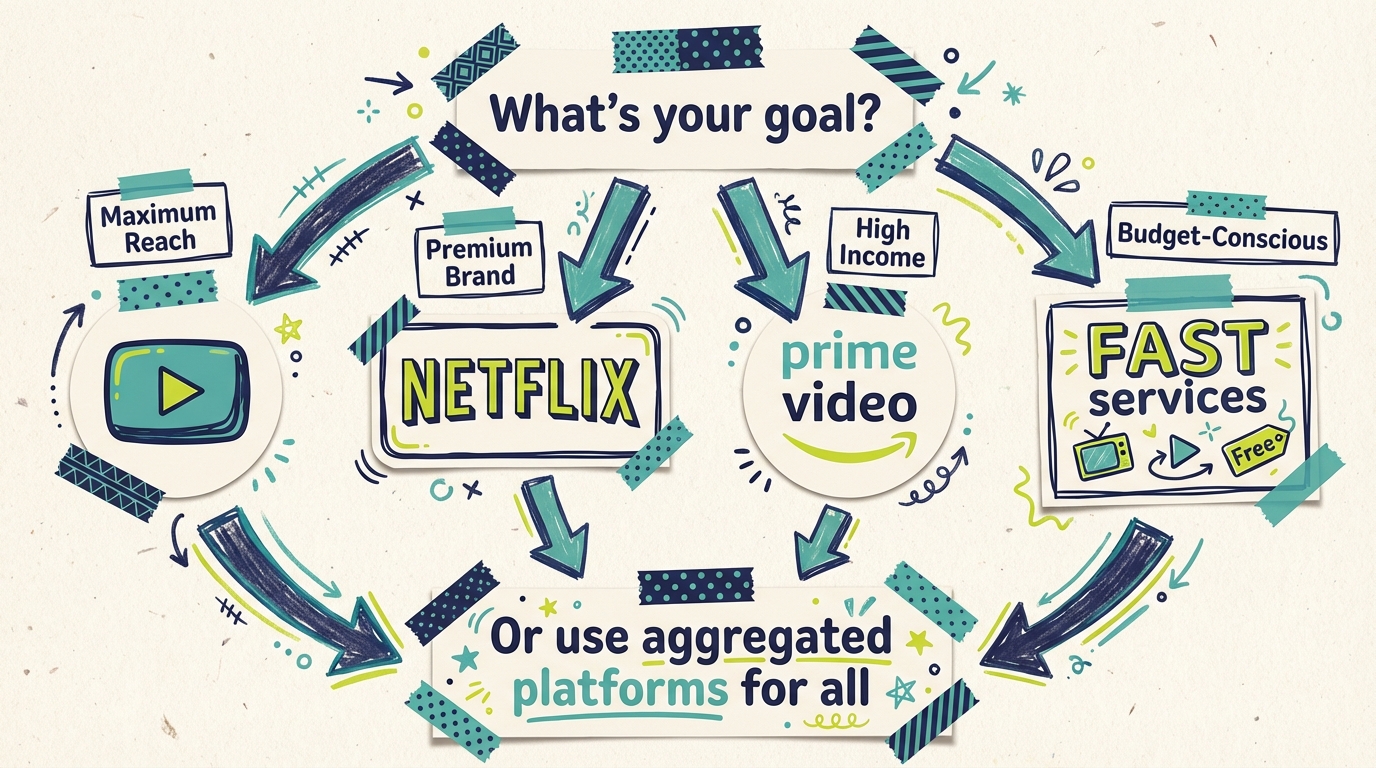
The best platform depends on your goals. YouTube offers maximum reach at moderate CPMs. Netflix provides premium brand environment but at higher costs. Amazon Prime Video reaches high-income households. FAST services like Tubi and Roku Channel offer budget-friendly options. For most small businesses, aggregated platforms that span all these services provide the best combination of reach and optimization.
---
Supporting data
Key statistics on streaming platform viewership (December 2025):
- 47.5%: Total streaming share of TV viewing (record high)
- 12.7%: YouTube's share of total TV viewing (No. 1)
- 9.0%: Netflix's share (record high, up 10% MoM)
- 4.3%: Prime Video's share (record high, up 12% MoM)
- 3.0%: Roku Channel's share (all-time high)
- 302M: Netflix global subscribers
- 115M: U.S. viewers seeing Prime Video ads monthly
- 70M: Netflix ad-tier monthly active users
- 54%: Streaming share on Christmas Day (single-day record)
- $50: Minimum to start CTV advertising with Adwave
Data sources:
---
Get started with streaming advertising
Ready to reach viewers on YouTube, Netflix, and 100+ other streaming channels? You don't have to choose just one platform.
Adwave makes streaming TV advertising accessible to businesses of all sizes. Create a professional TV commercial in minutes using AI, then launch it across the most-watched streaming services starting at just $50.
No video production experience required. No massive budgets. No choosing between platforms.
See how it works | View pricing
---
Statistics Boxes
Stat 1:
- Number: 12.7%
- Text: YouTube's share of total U.S. TV viewing (No. 1)
Stat 2:
- Number: 9.0%
- Text: Netflix's share (record high)
Stat 3:
- Number: 47.5%
- Text: Total streaming share of TV viewing
Version history
| Version | When | Summary |
|---|---|---|
| v1 | 6/20/2026, 3:11:54 AM | migration import |