CTV Advertising Benchmarks: What Good Performance Looks Like
slug: ctv-advertising-benchmarks · status: draft · score: 79% · 1 versions
View published version → · Contentful entry: 1Zcg5iooiZFTJuCChSsJvp
Validation
| Rule | Detail | |
|---|---|---|
| pass | No banned competitors | No banned competitors |
| pass | No emdashes | No emdashes |
| pass | Avoid AI telltale words | No AI telltale words |
| pass | Primary keyword in title | No primary keyword to check |
| pass | Use contractions | Contractions used |
| fail | Minimum internal links | Internal links not in sitemap: /how-it-works, /resources/ctv-measurement-attribution-guide, /features, /features, /resources/ctv-advertising-statistics-2025, /resources/ctv-measurement-attribution-guide, /resources/ctv-vs-meta-ads-comparison, /resources/first-tv-ad-beginners-guide |
| fail | FAQ section required | Missing FAQ / 'Common questions answered' section |
| fail | Author assigned | No author assigned (never use 'Adwave Team' for new content) |
| pass | Title length 50-60 | Title length 60 |
| pass | Minimum 4 images | 5 images |
| pass | SEO description under 160 | seoDescription 156 chars |
| pass | Adwave mention cadence | 4 Adwave mentions |
| pass | Short description present | shortDescription 162 chars |
| pass | Word count by type | Word count 1689 within target |
| warn | Year-dated title for evergreen types | Year-dated type should include (2026) in the title |
| pass | No manual table of contents | No manual TOC |
Images (5)
Content
CTV Advertising Benchmarks: What Good Performance Looks Like
SEO Description: Learn the key CTV advertising benchmarks for CPM, video completion rate, and ROAS. Use these industry standards to measure your connected TV campaign performance.
---
You've launched a CTV campaign, the impressions are rolling in, and the completion rates look solid. But how do you actually know if your CTV advertising benchmarks are good? Is a 92% video completion rate excellent, average, or a sign something's wrong? Without industry benchmarks to compare against, you're flying blind.
The good news: CTV advertising has matured enough that we now have reliable performance standards across key metrics. Whether you're evaluating CPM efficiency, video completion rates, or downstream conversions, this guide gives you the numbers you need to measure your connected TV campaigns like a pro.
Why CTV Benchmarks Matter
Running TV ads without benchmarks is like grading a test without an answer key. You might feel good about your results, but you have no way to know if you're actually succeeding.
CTV benchmarks help you:
- Set realistic expectations before launching campaigns
- Identify underperforming campaigns that need optimization
- Justify budgets with stakeholders who want to see industry comparisons
- Spot opportunities where you're outperforming the market
The CTV market is growing rapidly, with eMarketer projecting $33.35 billion in CTV ad spending for 2025, a 15.8% year-over-year increase. As more advertisers enter the space, understanding what "good" looks like becomes increasingly important.
CPM Benchmarks by Platform and Inventory Type
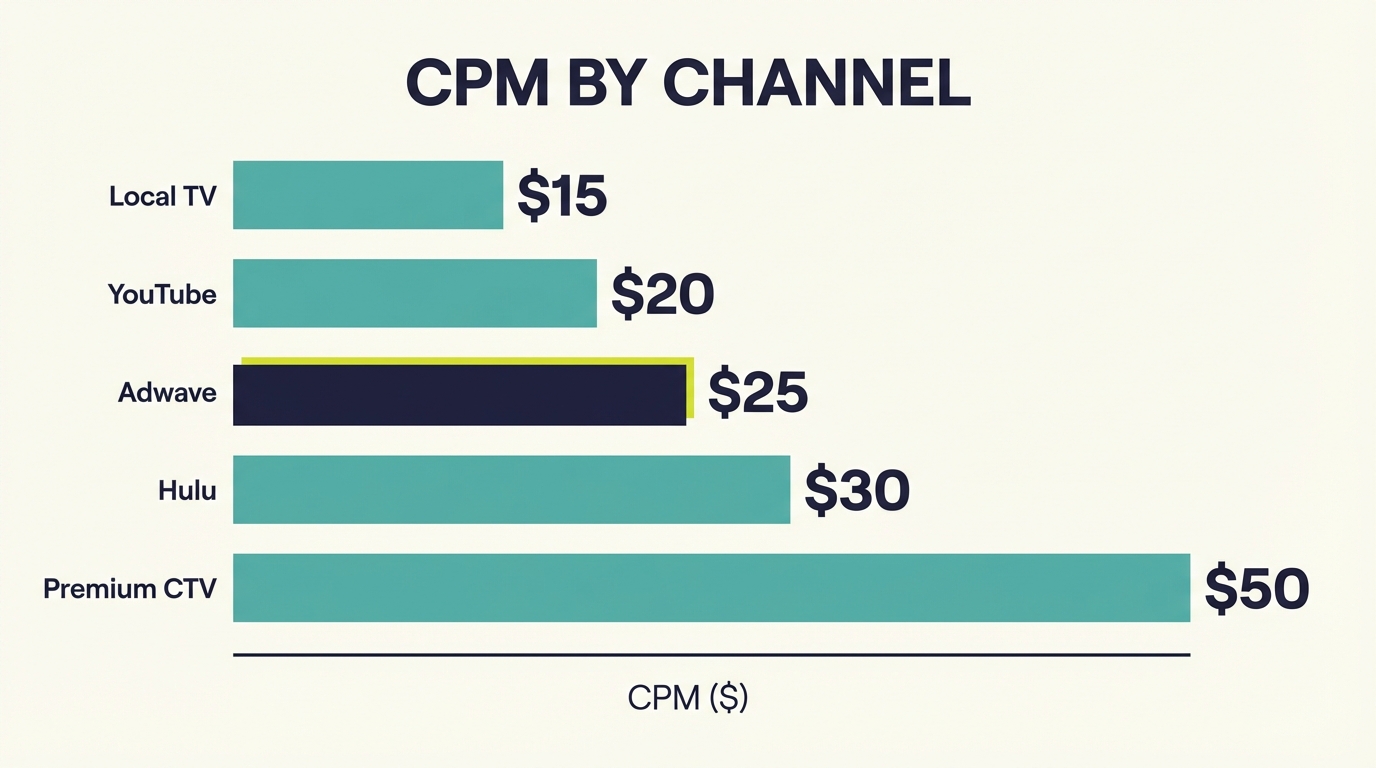
CPM (Cost Per Mille, or cost per thousand impressions) varies significantly based on where your ads run and how premium the inventory is.
Industry CPM Ranges
Here's what you can expect to pay across different channels:
What these numbers mean for you:
If you're paying above $40 CPM on CTV, you're likely accessing premium inventory (think live sports or top-tier programming). If you're paying under $20, you're probably running on FAST channels (Free Ad-Supported Streaming TV) like Tubi or Pluto TV, which still reach engaged audiences at lower costs.
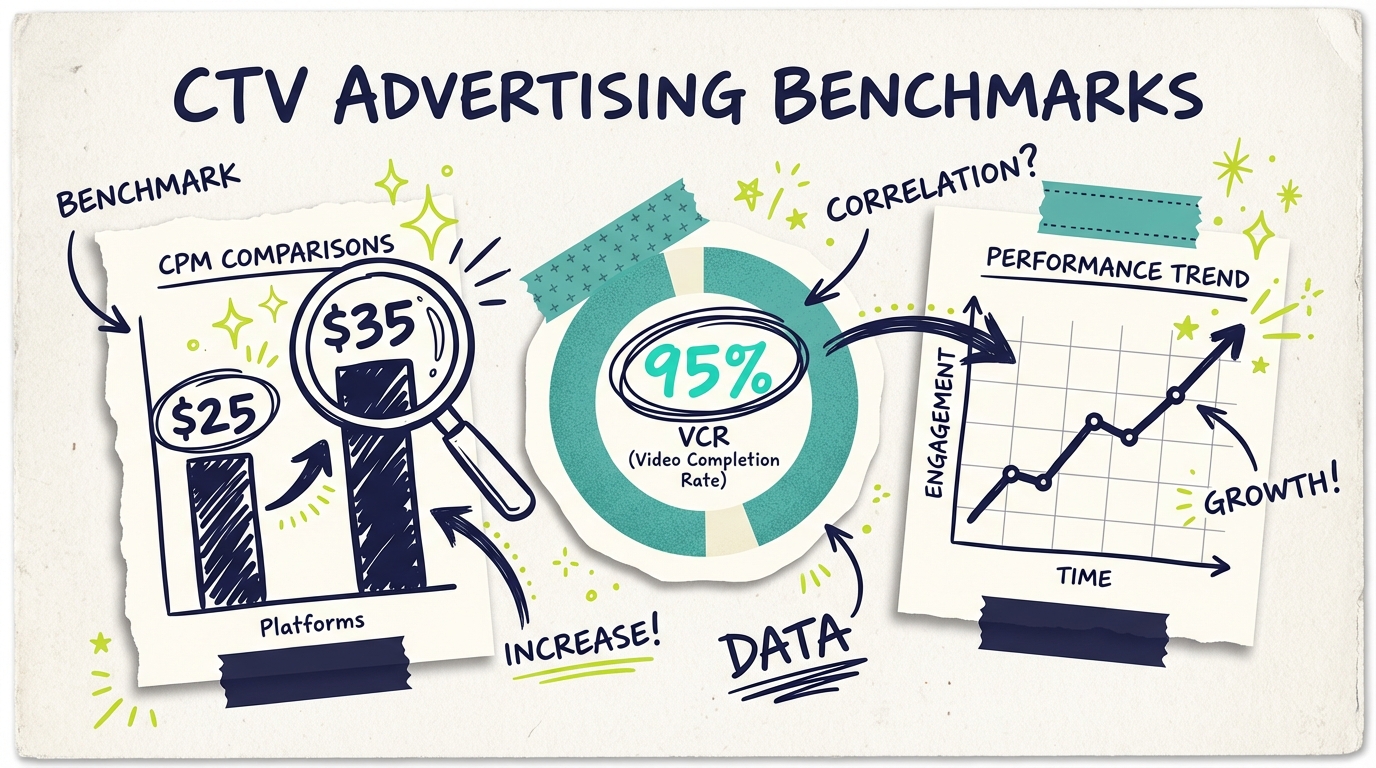
For small businesses using platforms like Adwave, CPMs typically fall in the $15-35 range, with most campaigns averaging around $25. This makes CTV surprisingly accessible compared to the $50+ CPMs that enterprise advertisers often pay for premium placements.
Video Completion Rate (VCR) Standards
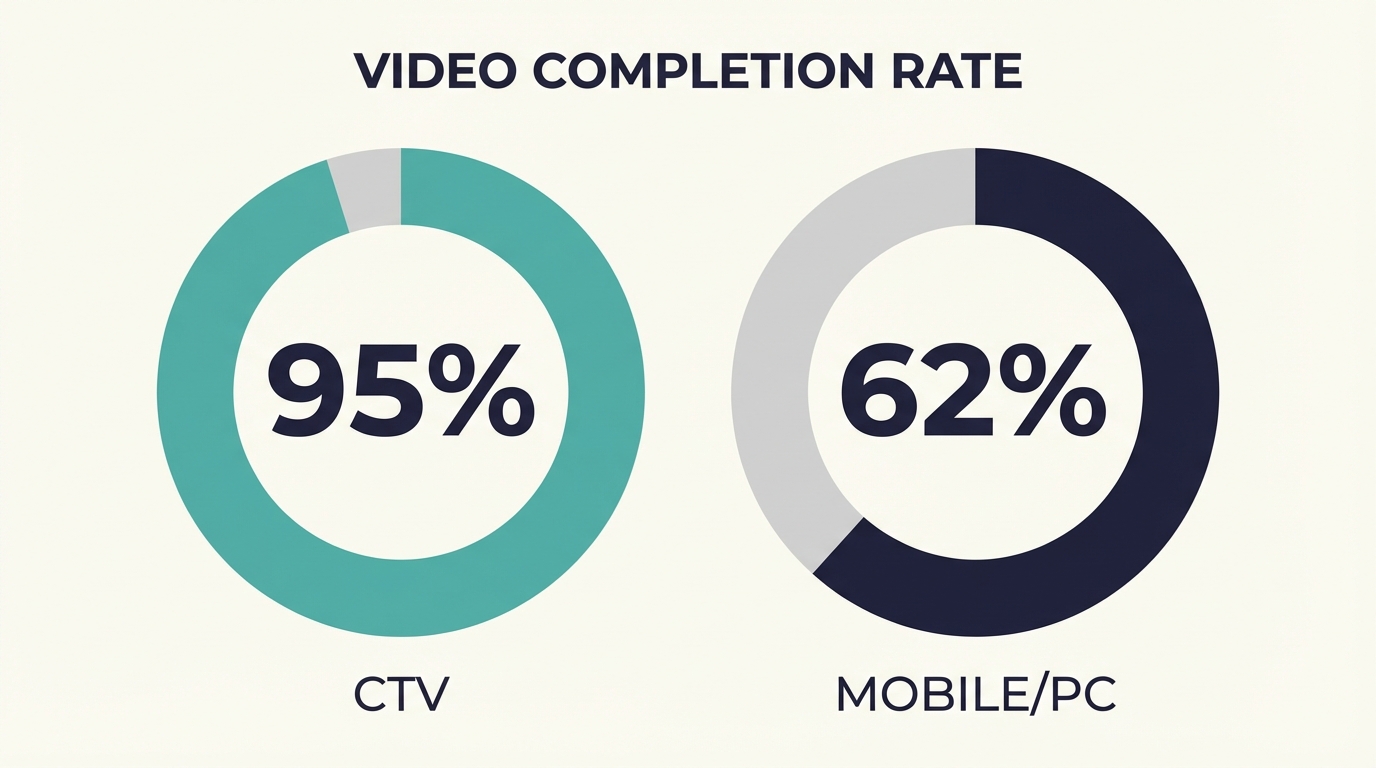
Video Completion Rate measures what percentage of viewers watch your entire ad. It's one of CTV's biggest advantages over other digital channels.
CTV VCR Benchmarks
CTV consistently delivers exceptional completion rates:
- Overall CTV average: 90-95%
- 30-second ads: 95.92% VCR
- 15-second ads: 93.88% VCR
- 10-second or less: 90.4% VCR
For comparison, PC and mobile video ads combined average just 62% completion, according to Marketing Charts. CTV's non-skippable, lean-back viewing environment is why completion rates are so much higher.
How to interpret your VCR:
- Above 95%: Excellent, you're at or above industry standard
- 90-95%: Good, performing as expected
- 85-90%: Acceptable, but look for optimization opportunities
- Below 85%: Investigate, could indicate inventory or targeting issues
If your VCR is significantly below 85%, check your ad length and creative quality. While CTV ads are technically non-skippable, some inventory sources have lower completion guarantees.
Cost Per Completed View (CPCV) Expectations
CPCV takes your CPM and adjusts it for completion rate, giving you a more accurate picture of what you're actually paying for engaged viewers.
The formula: CPCV = CPM ÷ (VCR × 10)
Example calculation:
- CPM: $25
- VCR: 95%
- CPCV: $25 ÷ (0.95 × 10) = $2.63 per completed view
CPCV Benchmarks
A healthy CPCV for CTV campaigns falls between $2-4. If you're paying more than $5 per completed view, either your CPM is too high or your completion rates need attention.
ROAS Benchmarks by Industry
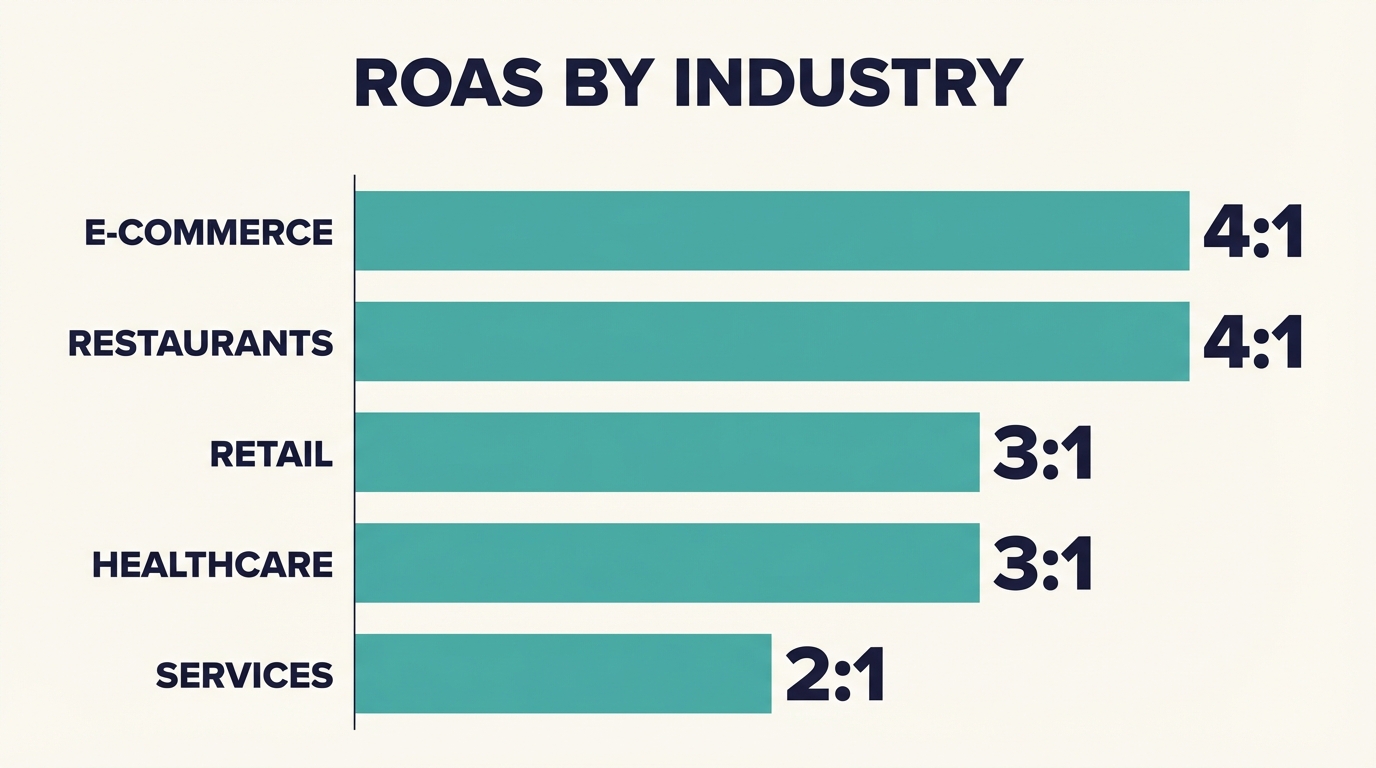
Return on Ad Spend (ROAS) is where things get industry-specific. A 3:1 ROAS might be excellent for one business and disappointing for another, depending on margins and customer lifetime value.
General ROAS Guidelines by Vertical
E-commerce/DTC Brands: 3:1 to 5:1
- Direct attribution is cleaner for online purchases
- Consider assisted conversions from TV-driven awareness
Local Retail: 2:1 to 4:1
- Harder to track foot traffic attribution
- Survey customers on how they heard about you
Restaurants: 3:1 to 6:1
- TV drives brand recall for dining decisions
- Track reservation and order spikes after campaigns
Professional Services: 2:1 to 3:1
- Longer sales cycles mean delayed ROAS
- Focus on lead quality, not just quantity
Healthcare: 2:1 to 4:1
- New patient value is typically high
- Compliance considerations affect creative options
Remember: CTV is primarily a brand awareness channel. Direct-response ROAS comparisons to bottom-funnel channels like search aren't apples-to-apples. Read more about measuring CTV performance to understand the full picture.
Brand Lift Benchmarks
Beyond direct conversions, CTV excels at building brand awareness and consideration. Brand lift studies measure these upper-funnel impacts.
Typical Brand Lift Results from CTV
- Aided awareness lift: 5-15% increase
- Ad recall lift: 10-25% increase
- Brand consideration lift: 3-8% increase
- Purchase intent lift: 2-5% increase
These numbers compound over time. A 10% lift in awareness today becomes more customers tomorrow. According to DISQO's CTV effectiveness research, CTV particularly shines at driving incremental reach among audiences that linear TV can't reach, especially younger cord-cutters.
Site Visit and Conversion Rate Standards
When measuring CTV's impact on website traffic and conversions, timing matters. Unlike search ads, TV doesn't drive immediate clicks. Instead, look for lift in these metrics:
Website Traffic Patterns
During campaign:
- 10-30% increase in direct traffic
- 15-40% increase in branded search
Post-campaign (1-2 weeks after):
- Traffic typically stabilizes 5-15% above pre-campaign baseline
Conversion Attribution
Most CTV platforms, including Adwave's dashboard, track:
- QR code scans: Direct response from viewers
- Website visits from exposed households: IP-matched attribution
- Brand search lift: Increases in people searching your business name
A healthy benchmark: 0.5-2% of reached households should take a measurable action (visit site, search brand, scan QR code) within 7 days of exposure.
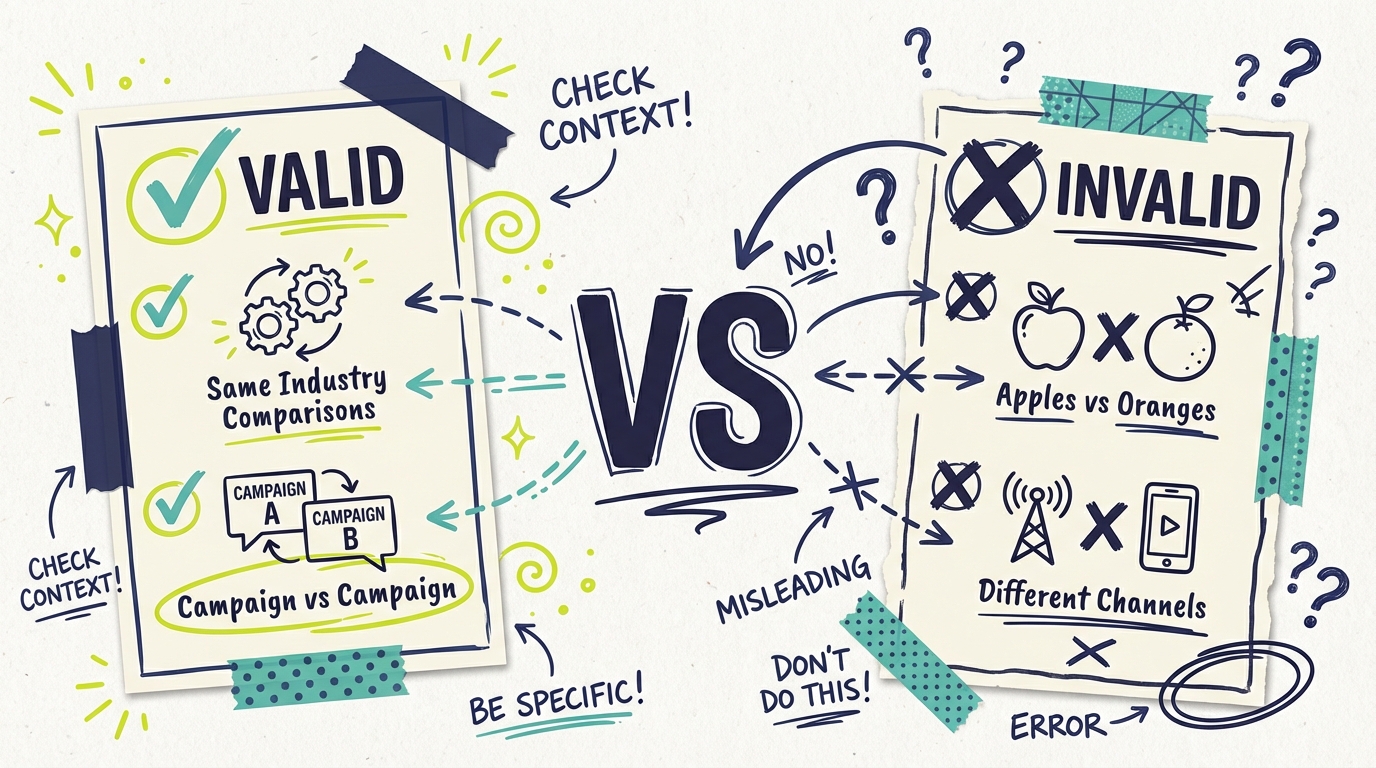
How to Use Benchmarks (Without Comparing Apples to Oranges)
Not all benchmark comparisons are valid. Here's how to use these numbers responsibly:
Valid Comparisons
- Your campaign vs. your industry vertical
- Your campaign vs. your previous campaigns
- Your CPM vs. similar inventory types
- Your VCR vs. similar ad lengths
Invalid Comparisons
- CTV ROAS vs. search ROAS (different funnel stages)
- Local campaign CPM vs. national campaign CPM (different inventory)
- Brand awareness campaign vs. direct response benchmarks (different goals)
- New brand vs. established brand performance (different baselines)
The best benchmark is your own historical performance. Once you've run 2-3 campaigns, you'll have a personal baseline that's more relevant than any industry average.
Improving Below-Benchmark Performance
If your metrics aren't hitting these benchmarks, here are the most common fixes:
Low VCR (Below 85%)
- Check ad length: Shorter ads (15-second) often perform better
- Review creative quality: Is the ad engaging from the first frame?
- Audit inventory sources: Some exchanges have lower-quality placements
High CPM (Above $40 for SMB)
- Expand targeting: Overly narrow audiences cost more
- Try different dayparts: Evening prime time costs more than daytime
- Consider FAST channels: Tubi, Pluto TV offer lower CPMs with good reach
Low ROAS
- Check attribution windows: Are you measuring long enough?
- Review targeting: Are you reaching your actual customers?
- Audit creative messaging: Is the CTA clear?
- Consider the funnel: CTV builds awareness; combine with retargeting for conversions
No Measurable Lift
- Run longer: Brand lift needs 4+ weeks to materialize
- Increase frequency: Viewers need 3-5 exposures for recall
- Add measurement: Implement website tracking, use branded search monitoring
Track Your Performance with Clear Benchmarks
Understanding CTV advertising benchmarks transforms how you evaluate campaigns. Instead of wondering if 94% completion is good (it is), you can confidently optimize toward industry standards and identify genuine problems when they occur.
The key takeaways:
- CPM: Expect $15-35 for SMB-friendly platforms, $25-65 for premium inventory
- VCR: Target 90%+ (CTV's big advantage over digital video)
- CPCV: Keep it under $4 for healthy efficiency
- ROAS: Varies by industry, but 2:1 to 4:1 is a reasonable starting point
- Brand lift: 5-15% awareness increase is a strong result
Ready to see how your campaigns stack up? Adwave's analytics dashboard tracks impressions, completion rates, and audience reach so you can measure performance against these benchmarks from day one. Create your first ad free and see your metrics in real-time.
---
Related Resources:
Version history
| Version | When | Summary |
|---|---|---|
| v1 | 6/20/2026, 3:11:54 AM | migration import |