What Is Netflix's Share of TV Viewing? (Q4 2025)
slug: netflix-tv-viewing-share-q4-2025 · status: draft · score: 78% · 1 versions
View published version → · Contentful entry: 1AmmFrNOfjrKybQ19T7xd7
Validation
| Rule | Detail | |
|---|---|---|
| pass | No banned competitors | No banned competitors |
| pass | No emdashes | No emdashes |
| warn | Avoid AI telltale words | AI telltale words found: landscape, leverage |
| pass | Primary keyword in title | No primary keyword to check |
| pass | Use contractions | Contractions used |
| fail | Minimum internal links | Internal links not in sitemap: /resources/best-programmatic-advertising-platforms, /resources/average-ctv-cpm, /resources/ai-tv-commercials-small-business, /resources/tv-advertising-roi-calculation, /resources/disney-ad-supported-viewers-157m, /resources/prime-video-ad-viewers, /resources/tv-advertising-for-small-business, /resources/how-to-advertise-on-tv, /how-it-works, /pricing, /resources/best-programmatic-advertising-platforms, /resources/average-ctv-cpm, /resources/ai-tv-commercials-small-business, /resources/tv-advertising-roi-calculation, /resources/disney-ad-supported-viewers-157m, /resources/prime-video-ad-viewers, /resources/tv-advertising-for-small-business, /resources/how-to-advertise-on-tv, /how-it-works, /pricing |
| pass | FAQ section required | FAQ section present |
| fail | Author assigned | No author assigned (never use 'Adwave Team' for new content) |
| pass | Title length 50-60 | Title length 48 |
| pass | Minimum 4 images | 5 images |
| warn | SEO description under 160 | seoDescription 163 chars (keep under 160) |
| pass | Adwave mention cadence | 3 Adwave mentions |
| pass | Short description present | shortDescription 198 chars |
| warn | Word count by type | Word count 3899 well above target (1500-2500) |
| warn | Year-dated title for evergreen types | Year-dated type should include (2026) in the title |
| pass | No manual table of contents | No manual TOC |
Images (5)
Content
What Is Netflix's Share of TV Viewing? (Q4 2025)
Netflix captured 9.0% of total U.S. TV viewing time in December 2025, reaching a new all-time high for the platform according to Nielsen's Gauge report. That 9% share represents a 10% increase from November and marks a significant milestone for the streaming giant that once seemed allergic to advertising. The number matters because Netflix isn't just a place where people binge shows anymore. It's where Americans spend nearly one in every ten minutes of television time, and with its ad-supported tier now reaching 70 million monthly active users globally, that attention is increasingly accessible to advertisers of all sizes. Here's what the data reveals and how small businesses can take advantage of Netflix's growing dominance.
---
What the data shows
Netflix's December 2025 performance tells a story of sustained growth that defied the typical seasonal slowdown. While many expected the holidays to scatter viewers across family activities and travel, Netflix commanded more attention than ever, driven by a combination of blockbuster content and strategic programming.
The 9.0% share of total TV viewing represents Netflix's highest mark in Nielsen's measurement history. To put that in context, this means Netflix alone captures nearly as much TV viewing time as all of cable news, sports, and entertainment combined when you look at individual networks. The streaming service has come a long way from its DVD-by-mail origins, and the December numbers suggest the ceiling hasn't been reached.
What drove this record performance? Content, primarily. "Stranger Things" dominated December viewing with over 15 billion minutes watched, making it the most-streamed title of the month across all platforms. The show's Season 5 release, split into two volumes with the second dropping on Christmas Day, created appointment viewing for millions of households. Netflix also benefited from its NFL Christmas Day games, which marked the streamer's second year hosting live football and helped attract viewers who might otherwise have been watching traditional broadcast networks.
The month-over-month growth of 10% is particularly striking because November wasn't exactly a slow period. Netflix had already been performing well, but December's content slate pushed viewership to new heights. This pattern, strong performance building on strong performance, suggests Netflix has found a formula that works: premium content releases timed to maximize household viewing occasions.
Year-over-year, the trajectory is equally impressive. In December 2024, Netflix held an 8.5% share of TV viewing. The jump to 9.0% represents a 0.5 percentage point gain, or roughly 6% growth year-over-year. While that might sound modest, in the context of a market where every streaming service is fighting for attention, gaining half a percentage point of total TV time is a substantial achievement.
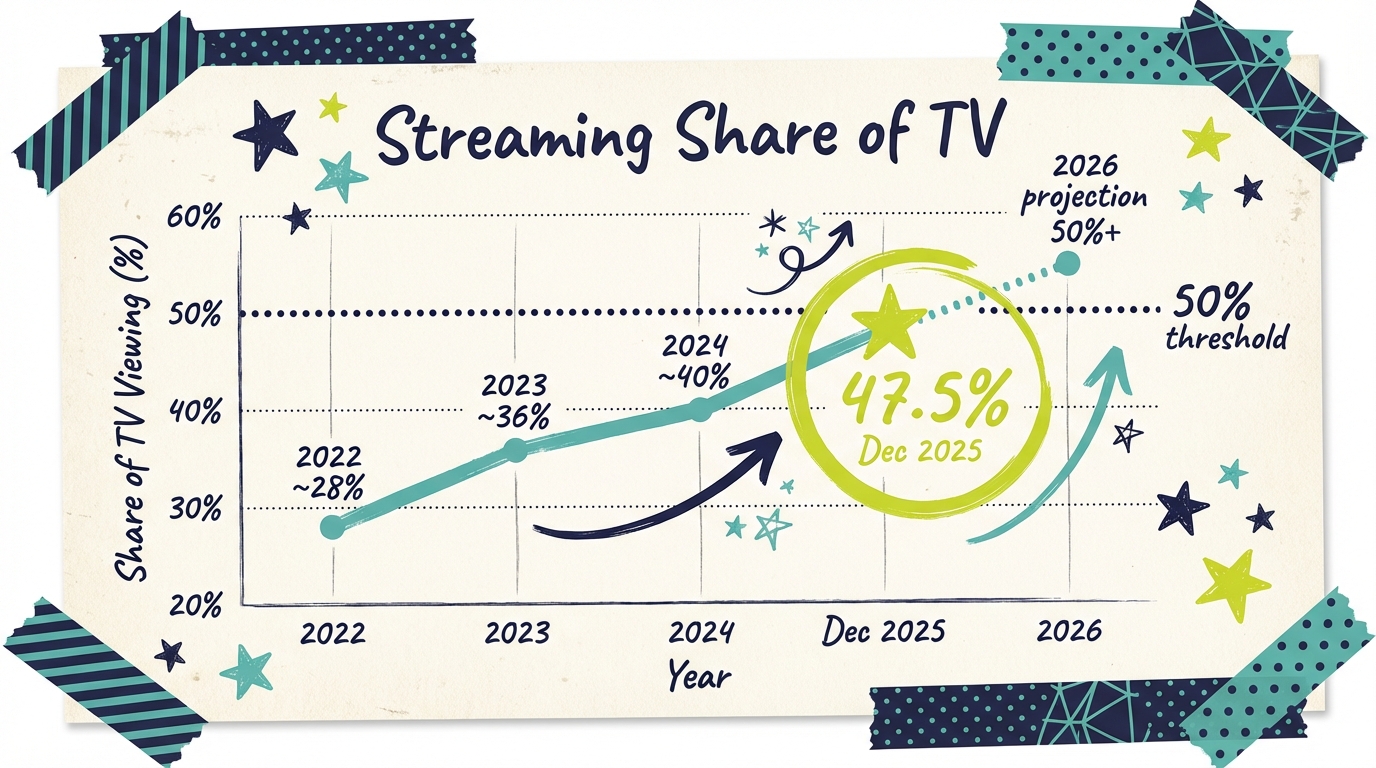
The broader streaming category also set records in December, capturing 47.5% of all TV viewing. Netflix's 9% share means it commands about 19% of all streaming time, cementing its position as the second-largest streaming platform behind YouTube's dominant 12.7% share. Together, these two platforms account for more than 21% of all television viewing in American households.
For advertisers, what makes Netflix's growth particularly relevant is the composition of that viewership. Unlike the early days of streaming when Netflix was entirely ad-free, the platform now has a substantial ad-supported tier. According to Netflix's own reporting, their ad tier reached 70 million monthly active users globally in late 2025, with roughly 40% of new subscribers choosing the cheaper, ad-supported option. That means a meaningful portion of Netflix's 9% viewing share is now addressable advertising inventory.
---
Breaking down the numbers
The headline 9.0% figure tells only part of the story. Understanding who watches Netflix, when they watch, and how they access the service reveals opportunities that raw viewership numbers alone can't capture.
By platform comparison
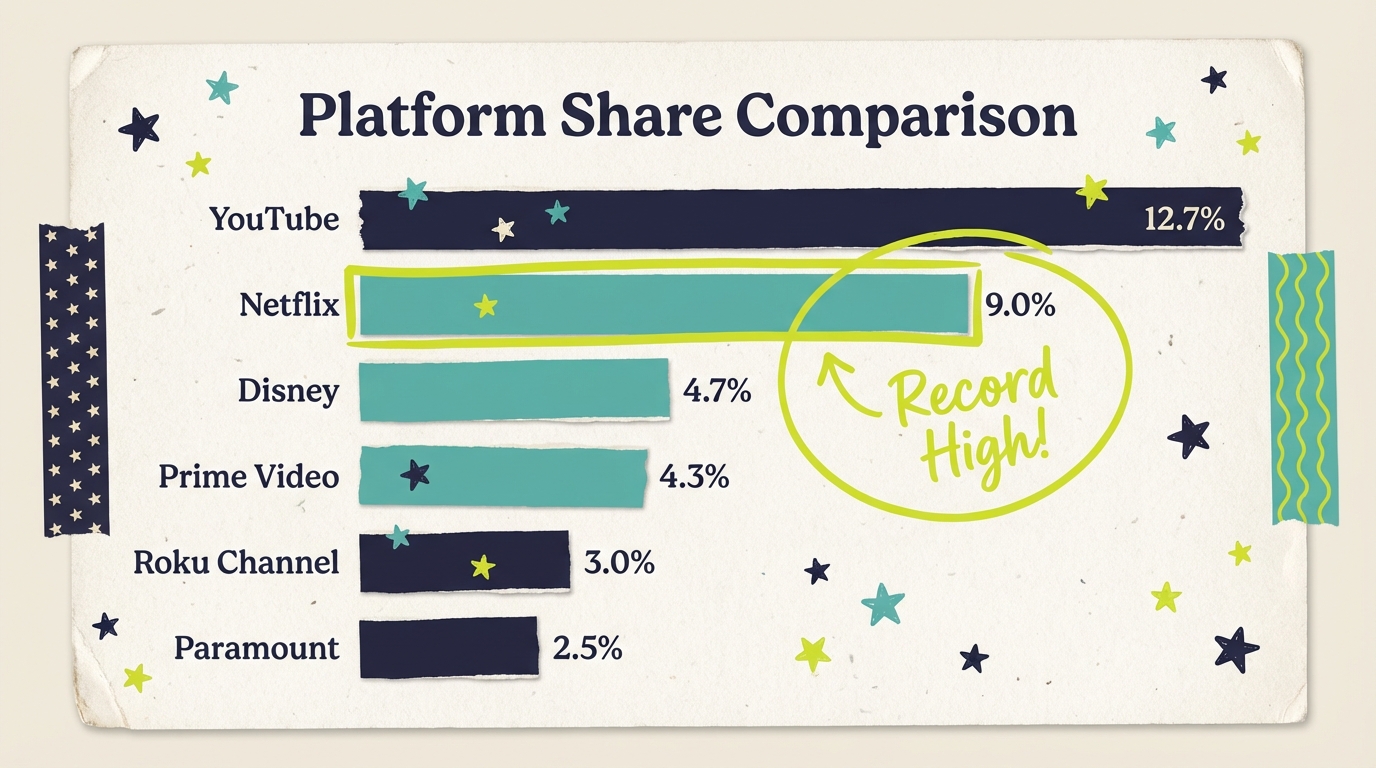
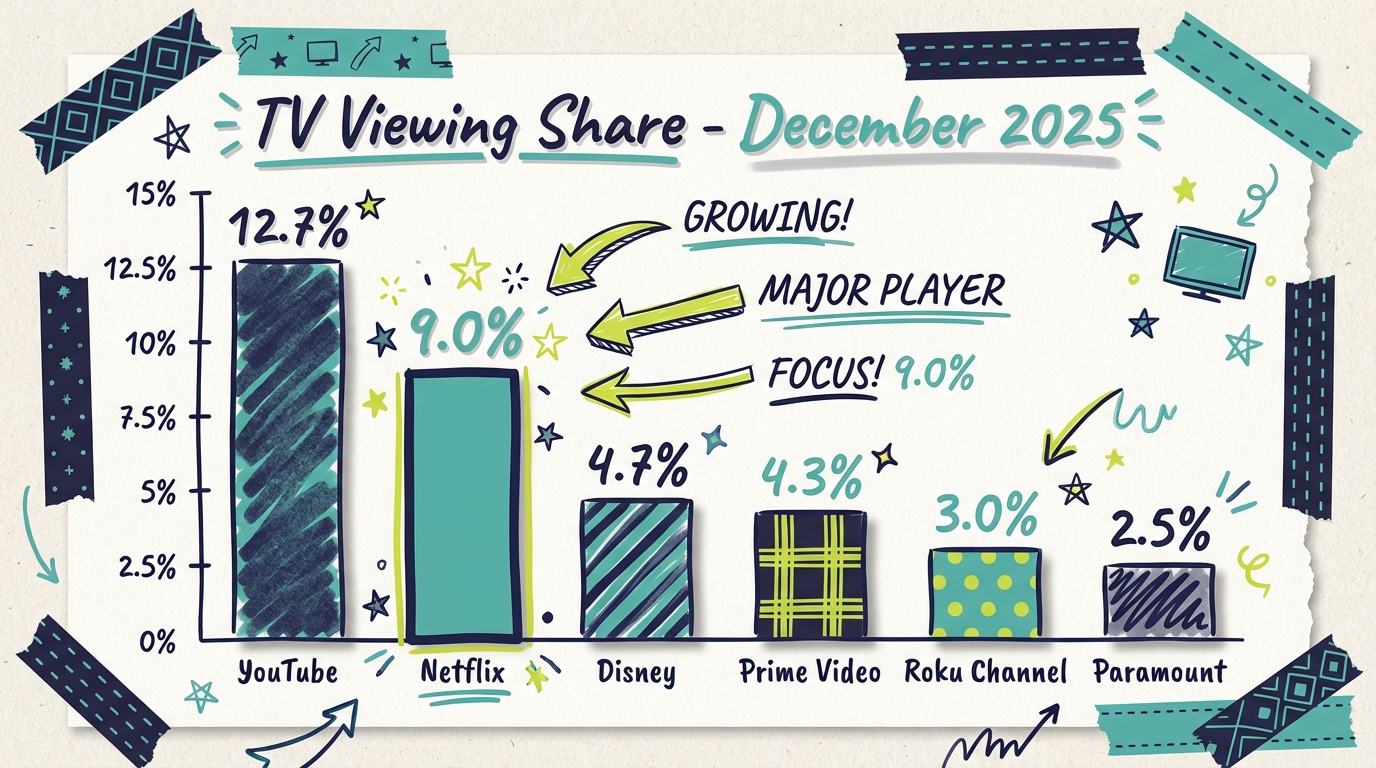
Netflix's position in the streaming hierarchy has solidified, though it still trails YouTube significantly. Here's how the major platforms compared in December 2025:
- YouTube: 12.7% of total TV viewing (the undisputed leader)
- Netflix: 9.0% (record high, up from 8.5% in December 2024)
- Disney combined: 4.7% (includes Disney+, Hulu, and ESPN+)
- Prime Video: 4.3% (record high, driven by NFL Thursday Night Football)
- Roku Channel: 3.0% (record high)
- Paramount Streaming: 2.5% (up 10%, driven by "Landman")
What's notable here is that Netflix's 9% share exceeds the combined share of Prime Video and Paramount Streaming. It's also nearly double the share of any single Disney property when separated from their bundle. This dominance gives Netflix significant leverage in the advertising market and ensures premium CPMs for inventory on the platform.
By content type
Netflix's December success was driven primarily by scripted entertainment, which represents the platform's core strength. "Stranger Things" alone accounted for 15 billion viewing minutes, making it the month's most-watched streaming title. For comparison, the second-place title, Paramount+'s "Landman," generated 6.2 billion minutes, less than half of Stranger Things' total.
Live sports also played a role, though a smaller one than you might expect. Netflix's Christmas Day NFL games attracted substantial audiences, but the majority of Netflix viewing remains on-demand scripted content. This distinction matters for advertisers: Netflix viewers are primarily in a lean-back, entertainment-seeking mindset rather than the event-focused mode that characterizes live sports viewing.
By device and access
While Nielsen's Gauge specifically measures TV screen viewing (excluding mobile and desktop), Netflix's TV viewing comes through multiple pathways:
- Smart TVs with built-in Netflix apps: The largest share of TV viewing
- Streaming devices (Roku, Fire TV, Apple TV): Significant portion, especially in older TV households
- Gaming consoles: A meaningful contributor, particularly among younger demographics
- Casting from mobile devices: Growing category as screen mirroring improves
For advertisers, this device fragmentation matters less than it might seem. Regardless of how viewers access Netflix on their TV, the advertising experience and targeting capabilities remain consistent through Netflix's ad platform.
Christmas Day performance
December 25, 2025 deserves special attention because it represented a watershed moment for streaming generally and Netflix specifically. On that single day:
- Total streaming viewership hit 55.1 billion minutes, shattering the previous record by 8%
- Streaming captured 54% of all TV viewing for the day, the highest single-day share ever recorded
- Netflix and Prime Video together commanded 22.5% of total TV usage
- Netflix's "Stranger Things" Volume 2 release drove sustained evening viewership
This Christmas Day performance suggests that streaming has definitively become the default choice for holiday viewing. For advertisers planning seasonal campaigns, this data confirms that streaming platforms, and Netflix in particular, should be central to any holiday media strategy.
---
Why it matters for your business
Netflix's record viewership creates opportunities that didn't exist even two years ago. The platform's evolution from an ad-free premium service to one with a substantial ad-supported tier has fundamentally changed the advertising equation for small businesses.
The core opportunity is straightforward: Netflix viewers now include people who actively chose a lower-cost, ad-supported experience. These aren't viewers who are grudgingly tolerating ads. They're viewers who made a conscious tradeoff, accepting advertising in exchange for a lower monthly fee. That mindset, combined with Netflix's premium content environment, creates favorable conditions for brand messaging.
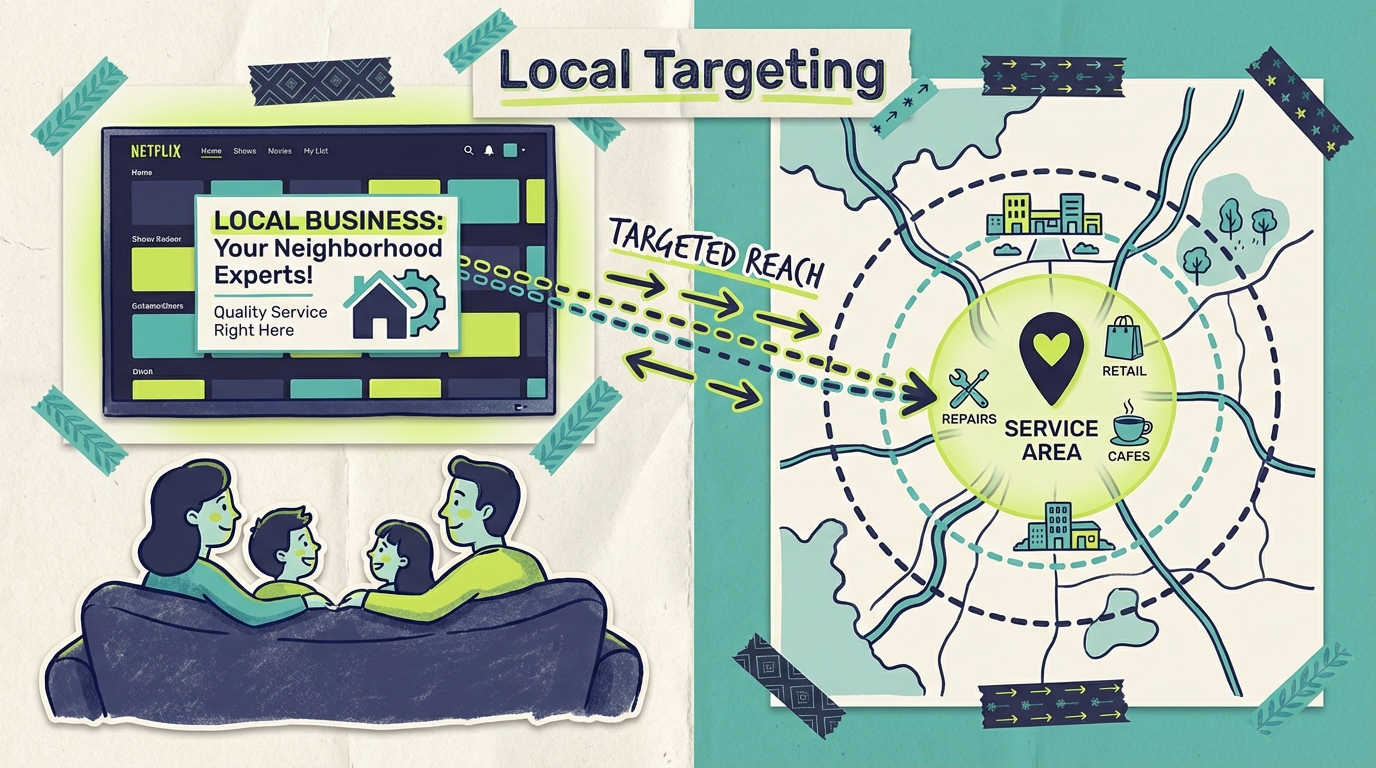
For local service businesses, Netflix advertising offers something that was previously unavailable: access to premium streaming audiences in specific geographic areas. A plumber in Phoenix can now reach homeowners watching "Stranger Things" in their exact service area. A restaurant in Boston can advertise to households within their delivery radius while those households are in a relaxed, entertainment-focused mindset. This combination of premium environment and geographic precision was impossible for small businesses until recently.
The content association benefit matters too. When your ad appears during Netflix programming, it benefits from the production quality and cultural relevance of the surrounding content. This isn't like advertising on a random cable network at 2 AM. It's advertising alongside content that viewers actively sought out and are engaged with. That context elevates your brand by association.
Consider the practical applications across different business types:
Restaurants and food service: Reach households during evening viewing when dinner decisions are being made or when late-night snack cravings hit. Netflix's content slate skews toward binge-worthy series that keep viewers on the couch, often thinking about food delivery.
Professional services: Build credibility through TV presence. When a local financial advisor or attorney appears on the same screen where viewers watch Netflix originals, it conveys legitimacy and scale that other advertising channels can't match.
Retail and e-commerce: Drive consideration during extended viewing sessions. Netflix viewers are often multitasking with phones nearby, making immediate response to compelling ads more likely than traditional TV viewing.
The accessibility angle is equally important. Traditional Netflix advertising through direct deals required six-figure commitments that put the platform out of reach for most businesses. Today, through programmatic CTV platforms like Adwave, small businesses can access Netflix inventory alongside 100+ other premium channels starting at just $50. There's no production budget required because AI generates broadcast-quality commercials from your website. No agency needed. Your ad can be running during Netflix programming within minutes.
This democratization of premium TV advertising is arguably the most significant development in small business marketing in years. The same screens that carry Super Bowl commercials now carry ads for local businesses, at price points that fit local business budgets.
---
How to take advantage of this trend
Understanding Netflix's dominance is useful. Knowing how to act on it is what grows your business. Here's how to approach Netflix and streaming TV advertising strategically.
Start with a test campaign that treats Netflix as part of a broader streaming mix rather than a standalone channel. The most effective approach for most small businesses involves running ads across multiple premium streaming platforms simultaneously, including Netflix, Hulu, Peacock, and others. This multi-platform strategy ensures you reach your target audience regardless of their streaming preferences, and it provides data on which platforms perform best for your specific business.
A reasonable test budget for most local businesses falls in the $200-500 range for a two-week campaign. This provides enough impressions to generate meaningful data without overcommitting before you understand what works. With CTV advertising costs averaging $20-35 CPM for most platforms, this budget delivers thousands of impressions in your target area.
Geographic targeting should be your primary focus if you're a local business. The power of streaming TV advertising lies in its ability to reach only the households that matter to your business. For a restaurant, that might mean a 5-mile radius. For a home services company, perhaps a 25-mile radius covering your service area. For a regional retailer, multiple zip codes or even entire metropolitan areas. Set your geographic boundaries based on where your customers actually come from, not where you wish they came from.
Timing matters, though perhaps less than you might think. Netflix viewership peaks during evening hours, but substantial viewing happens throughout the day. For most local businesses, letting your ads run across all dayparts provides the best efficiency. The exception would be businesses with specific time-sensitive offers, like a restaurant promoting lunch specials, where daypart targeting makes strategic sense.
Creative quality affects performance significantly. While Netflix viewers are accustomed to high production values, they're also watching ads from major brands with massive budgets. The good news is that you don't need to match those budgets. What matters is clarity, relevance, and a clear call to action. AI-powered creative tools can generate professional 30-second spots from your website, ensuring your ad looks polished without requiring expensive video production.
Measurement requires a different mindset than digital performance marketing. TV advertising ROI shows up in brand search lift, website traffic increases, and customer survey responses rather than direct click attribution. Track these metrics before, during, and after your campaign. Look for increases in branded search queries, direct traffic to your website, and customers mentioning TV when asked how they heard about you.
When your test shows promising results, scale deliberately. Increase budget on the creative that performs best. Expand geographic targeting to adjacent areas. Add more streaming platforms to your mix. The goal is continuous improvement based on data, not dramatic swings based on assumptions.
---
The bigger picture
Netflix's 9% viewing share exists within a larger transformation of the television industry that has been decades in the making but has accelerated dramatically in recent years.
The streaming takeover is complete
December 2025's 47.5% streaming share isn't just another record. It represents a structural shift that's unlikely to reverse. Streaming now captures nearly half of all TV viewing time, up from 43.3% in December 2024 and just 35.9% in December 2023. At this pace, streaming will surpass 50% of total TV viewing within the next year, likely by summer 2026.
Cable and broadcast together now account for just 41.6% of TV viewing (21.4% broadcast, 20.2% cable), down from majority positions just a few years ago. The "other" category, which includes gaming and miscellaneous device usage, holds 10.9%. This composition means that streaming isn't just growing. It's actively taking share from traditional TV in a zero-sum competition for household attention.
The ad-supported streaming boom
What makes this streaming growth particularly relevant for advertisers is where the growth is happening. Ad-supported streaming, including Netflix's ad tier, is growing faster than subscription-only streaming. Viewers have shown they're willing to accept advertising in exchange for lower costs or free access, and platforms have responded by expanding their ad-supported offerings.
Netflix's 70 million ad-tier users globally represent just the beginning. Disney reported 157 million ad-supported viewers across Disney+ and Hulu. Amazon Prime Video defaulted all viewers to ads in January 2024, creating over 115 million ad-supported viewers overnight. The result is more premium streaming inventory available to advertisers than at any point in history.
What comes next
Industry analysts project streaming will exceed 50% of TV viewing by late 2026, with further gains likely as cord-cutting continues. Within that growth:
- Netflix is expected to maintain or grow its share through continued content investment
- Ad-supported tiers will become the default option for most streamers
- Local advertising capabilities will become more sophisticated
- Programmatic buying will expand, making streaming TV increasingly accessible to smaller advertisers
For small businesses, every percentage point that shifts from traditional TV to streaming represents inventory that's more targetable, more measurable, and more accessible. The days when TV advertising required six-figure budgets and agency relationships are definitively over.
---
What experts are saying
Industry analysts have taken note of Netflix's milestone performance and what it signals for the broader media landscape.
Nielsen's December Gauge report highlighted that "streaming shatters multiple records" and emphasized the significance of four platforms, including Netflix, achieving personal best shares in the same month. The research firm noted that the combination of premium content releases and live sports created a perfect storm for streaming viewership.
Advertising industry observers point to the implications for media buying. "Netflix's record share comes at precisely the moment when their ad tier has reached meaningful scale," noted analysis from eMarketer. "The combination of premium content environment and substantial ad-supported viewership makes Netflix inventory increasingly attractive for brand advertisers."
Trade publications have emphasized the competitive dynamics at play. As Deadline reported, December's results showed that "YouTube, Netflix, Prime Video all hit record viewing levels," suggesting the streaming market continues to expand rather than simply redistributing existing viewership.
What's notable is the consensus view that this growth is structural rather than cyclical. While December's content slate was exceptional, the underlying trends point toward continued streaming dominance. Netflix's investment in live sports, combined with its content library and growing ad-supported base, positions the platform for sustained relevance in the evolving TV landscape.
---
Common questions answered
How does Nielsen measure Netflix's viewing share?
Nielsen's Gauge methodology combines data from a nationally representative panel of U.S. households with smart TV automatic content recognition (ACR) technology. The measurement captures viewing on TV screens specifically, excluding mobile and desktop viewing. Netflix's 9% share represents the percentage of all time spent watching television that occurs on the Netflix app, regardless of whether viewers use the ad-free or ad-supported tier.
Does Netflix's viewing share include the ad-supported tier only?
No, the 9% viewing share includes all Netflix viewing on TV screens, both ad-supported and ad-free subscriptions. However, the ad-supported tier represents a growing portion of this viewership, with Netflix reporting that approximately 40% of new subscribers choose the ad-supported option. This means a substantial and increasing portion of Netflix's viewing share is addressable for advertisers.
How does Netflix compare to YouTube for advertising?
YouTube leads all streaming platforms with a 12.7% share of TV viewing, compared to Netflix's 9%. However, the advertising dynamics differ significantly. YouTube is ad-supported by default for most viewers, while Netflix's ad-supported tier represents a subset of total viewers. YouTube offers more granular targeting based on content and search behavior, while Netflix offers a premium content environment with higher production values. Many advertisers include both platforms in their streaming TV mix to capture different viewing contexts.
Can small businesses actually advertise on Netflix?
Yes, small businesses can access Netflix advertising inventory through programmatic CTV platforms. While direct deals with Netflix require significant minimum spends, programmatic access through platforms like Adwave allows businesses to run ads on Netflix alongside other premium channels starting at $50. The ads appear during content on Netflix's ad-supported tier, reaching viewers who chose the lower-cost subscription option.
What's the typical CPM for Netflix advertising?
Netflix CPMs through programmatic access typically range from $35-65, higher than many other streaming platforms due to the premium content environment. For comparison, platforms like Tubi and Pluto TV average $15-25 CPM, while Hulu typically ranges $24-35. The higher CPM reflects Netflix's brand-safe environment, engaged viewership, and premium content association. Many advertisers accept the higher CPM for Netflix inventory specifically because of these quality factors.
Is Netflix advertising effective for local businesses?
Yes, when combined with geographic targeting. Netflix advertising through programmatic platforms allows local businesses to reach only households within their service area or delivery radius. This precision targeting means you're not paying for impressions outside your market. Combined with the brand credibility of appearing on a premium platform, Netflix can be highly effective for local awareness building. The key is treating it as brand advertising, measuring success through brand search lift and customer surveys, rather than expecting direct click attribution.
---
Supporting data
Additional context on Netflix and streaming TV viewing:
- Total streaming share: Streaming captured 47.5% of U.S. TV viewing in December 2025, a new record (Nielsen Gauge, December 2025)
- Netflix YoY growth: Netflix share grew from 8.5% in December 2024 to 9.0% in December 2025, a 0.5 percentage point increase (Nielsen, December 2024)
- Stranger Things viewership: Generated over 15 billion viewing minutes in December 2025, the month's most-watched streaming title (Nielsen, December 2025)
- Christmas Day streaming record: 55.1 billion viewing minutes on December 25, 2025, shattering the previous record by 8% (Nielsen, December 2025)
- Netflix ad tier users: 70 million monthly active users globally on Netflix's ad-supported plan (Netflix, 2025)
- Streaming daily share record: Streaming captured 54% of TV viewing on Christmas Day 2025, the highest single-day share ever recorded (Nielsen, December 2025)
- Cable TV share: Cable captured 20.2% of TV viewing in December 2025, continuing its multi-year decline (Nielsen Gauge, December 2025)
- Broadcast TV share: Broadcast captured 21.4% of TV viewing in December 2025 (Nielsen Gauge, December 2025)
All sources linked above. Data current as of January 2026.
---
Get started with TV advertising
Ready to reach Netflix viewers and streaming audiences in your local area? Adwave makes TV advertising accessible for small businesses, with campaigns starting at just $50. No production budget required because AI creates your commercial. No agency needed.
Your ad can run on Netflix, Hulu, Peacock, and 100+ other premium channels, reaching viewers in the exact geographic areas that matter to your business. Start with a test campaign and see what streaming TV can do for your brand awareness.
See how it works | View pricing
---
Internal Links Used
- Nielsen's Gauge - in Opening paragraph
- programmatic CTV platforms - in Why it matters
- CTV advertising costs - in How to take advantage
- AI-powered creative tools - in How to take advantage
- TV advertising ROI - in How to take advantage
- 157 million ad-supported viewers - in The bigger picture
- 115 million ad-supported viewers - in The bigger picture
- TV advertising - in The bigger picture
- TV advertising - in CTA
- See how it works - in CTA
- View pricing - in CTA
---
Statistics Boxes
Stat 1:
- Number: 9.0%
- Text: Netflix's share of total U.S. TV viewing
Stat 2:
- Number: #2
- Text: Second-largest streaming platform by viewing share
Stat 3:
- Number: +0.5pts
- Text: Year-over-year growth from December 2024
---
Sources
| Stat | Source | URL | Data Date |
|---|---|---|---|
| Netflix 9.0% share | Nielsen Gauge | https://www.nielsen.com/news-center/2026/streaming-shatters-multiple-records-in-december-2025-with-47-5-of-tv-viewing-according-to-nielsens-the-gauge/ | December 2025 |
| Netflix 8.5% December 2024 | Nielsen Gauge | https://www.nielsen.com/news-center/2025/holidays-football-and-blockbusters-drive-record-highs-for-youtube-netflix-and-amazon-prime-video-in-december-according-to-the-gauge/ | December 2024 |
| Stranger Things 15B minutes | Nielsen Gauge | https://www.nielsen.com/news-center/2026/streaming-shatters-multiple-records-in-december-2025-with-47-5-of-tv-viewing-according-to-nielsens-the-gauge/ | December 2025 |
| Streaming 47.5% share | Nielsen Gauge | https://www.nielsen.com/news-center/2026/streaming-shatters-multiple-records-in-december-2025-with-47-5-of-tv-viewing-according-to-nielsens-the-gauge/ | December 2025 |
| Christmas Day 55.1B minutes | Nielsen Gauge | https://www.nielsen.com/news-center/2026/streaming-shatters-multiple-records-in-december-2025-with-47-5-of-tv-viewing-according-to-nielsens-the-gauge/ | December 2025 |
| Netflix ad tier 70M users | Netflix | https://www.netflix.com/tudum/articles/netflix-ad-supported-plan-70-million-monthly-users | 2025 |
| YouTube 12.7% share | Nielsen Gauge | https://www.nielsen.com/news-center/2026/streaming-shatters-multiple-records-in-december-2025-with-47-5-of-tv-viewing-according-to-nielsens-the-gauge/ | December 2025 |
| Cable 20.2%, Broadcast 21.4% | Nielsen Gauge | https://www.nielsen.com/news-center/2026/streaming-shatters-multiple-records-in-december-2025-with-47-5-of-tv-viewing-according-to-nielsens-the-gauge/ | December 2025 |
---
Images
| Image | Filename | Type | Placement | Description |
|---|---|---|---|---|
| Hero | hero.png | Bar chart | headerImage field | Bar chart showing Netflix's 9.0% share compared to other streaming platforms |
| Body 1 | platform-comparison.png | Chart | After "What the data shows" | Platform comparison bar chart for December 2025 |
| Body 2 | demographics-breakdown.png | Chart | After "Breaking down the numbers" | Donut chart showing Netflix viewer demographics |
| Body 3 | business-opportunity.png | Concept | After "Why it matters" | Local business targeting visualization |
| Body 4 | streaming-growth.png | Line graph | After "The bigger picture" | Streaming share growth trend 2022-2026 |
Version history
| Version | When | Summary |
|---|---|---|
| v1 | 6/20/2026, 3:11:54 AM | migration import |