What Percentage of TV is Broadcast? (Q4 2025)
slug: broadcast-tv-viewing-share-q4-2025 · status: draft · score: 83% · 1 versions
View published version → · Contentful entry: 6WJu9csDquVOPCLSU5liuI
Validation
| Rule | Detail | |
|---|---|---|
| pass | No banned competitors | No banned competitors |
| pass | No emdashes | No emdashes |
| warn | Avoid AI telltale words | AI telltale words found: landscape |
| pass | Primary keyword in title | No primary keyword to check |
| pass | Use contractions | Contractions used |
| fail | Minimum internal links | Internal links not in sitemap: /resources/what-is-connected-tv-advertising, /industries/home-services/plumbing/tv-advertising-plumbers, /industries/healthcare/dental-practices/tv-advertising-dentists, /resources/tv-advertising-for-small-business, /how-it-works, /pricing |
| pass | FAQ section required | FAQ section present |
| fail | Author assigned | No author assigned (never use 'Adwave Team' for new content) |
| pass | Title length 50-60 | Title length 45 |
| pass | Minimum 4 images | 6 images |
| pass | SEO description under 160 | seoDescription 142 chars |
| pass | Adwave mention cadence | 4 Adwave mentions |
| pass | Short description present | shortDescription 213 chars |
| pass | Word count by type | Word count 2886 within target |
| warn | Year-dated title for evergreen types | Year-dated type should include (2026) in the title |
| pass | No manual table of contents | No manual TOC |
Images (6)
Content
What Percentage of TV is Broadcast? (Q4 2025)
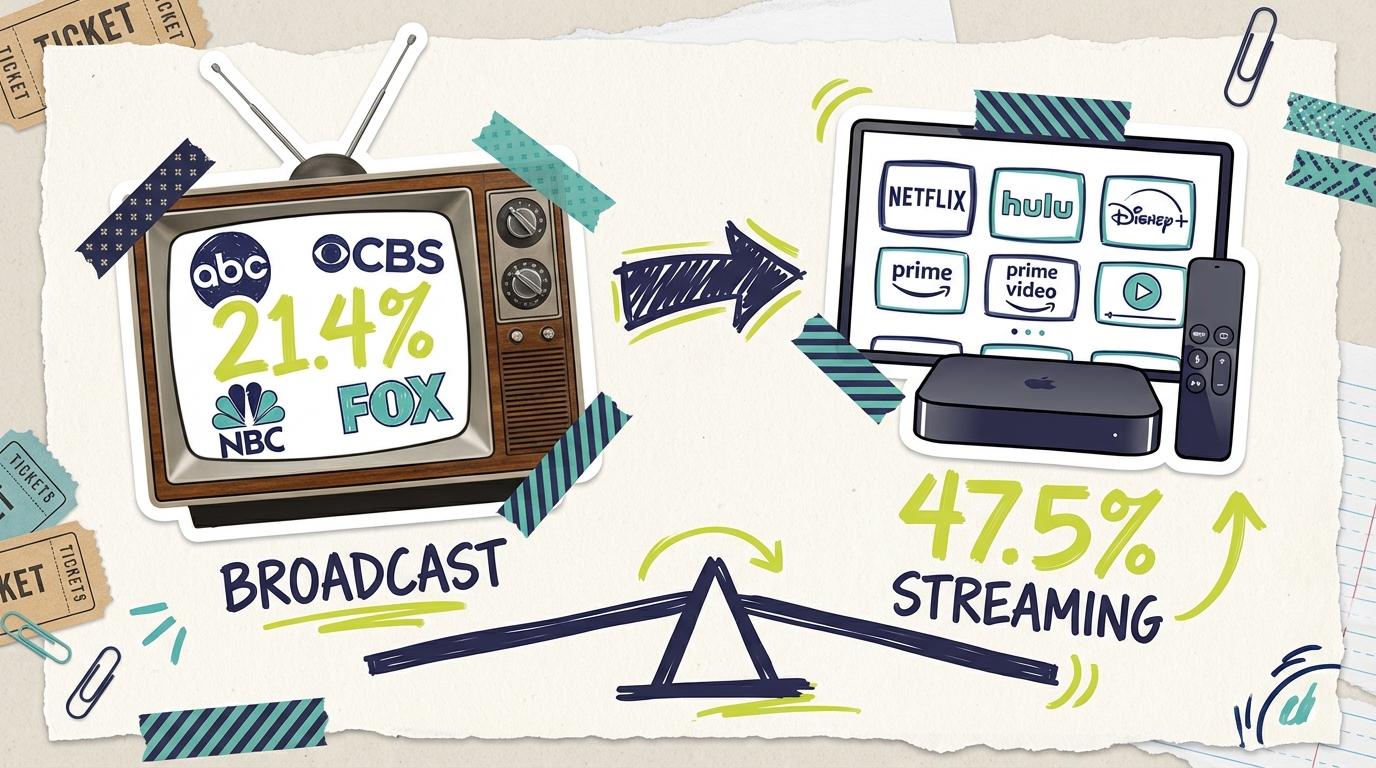
Broadcast television accounts for 21.4% of total U.S. TV viewing time, according to Nielsen's Gauge data from December 2025. That means the big four networks (ABC, CBS, NBC, and FOX) plus smaller broadcast channels now capture roughly one-fifth of all time Americans spend watching television. This continues the long-term decline from a few years ago when broadcast regularly commanded over a quarter of viewing time. For advertisers, understanding where broadcast fits in today's TV landscape is essential for making smart media buying decisions, especially as streaming dominates with a record 47.5% share.
December 2025 marked a significant month for television. While streaming shattered multiple records, broadcast held steady at just over 21%, slightly below cable's 20.2% share. The gap between broadcast (21.4%) and cable (20.2%) remains narrow, with both traditional TV categories now far behind streaming's dominant position. For businesses considering TV advertising, the question isn't whether to advertise on television, but how to reach viewers across an increasingly fragmented landscape.
---
What the data shows
December 2025 represented both a milestone and a confirmation of long-term trends. Broadcast's 21.4% share came during a month when streaming achieved its highest-ever recorded share at 47.5%.
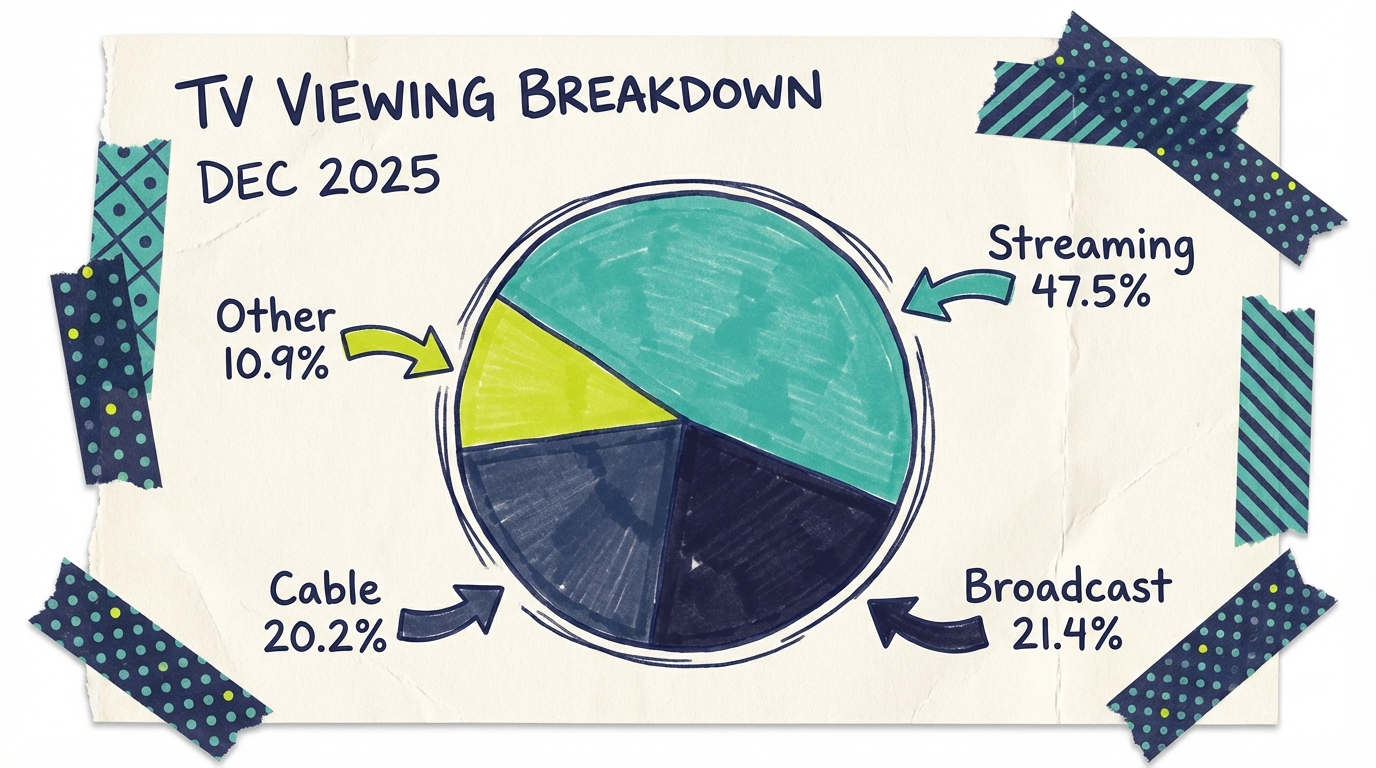
December 2025 TV viewing breakdown (Nielsen Gauge)
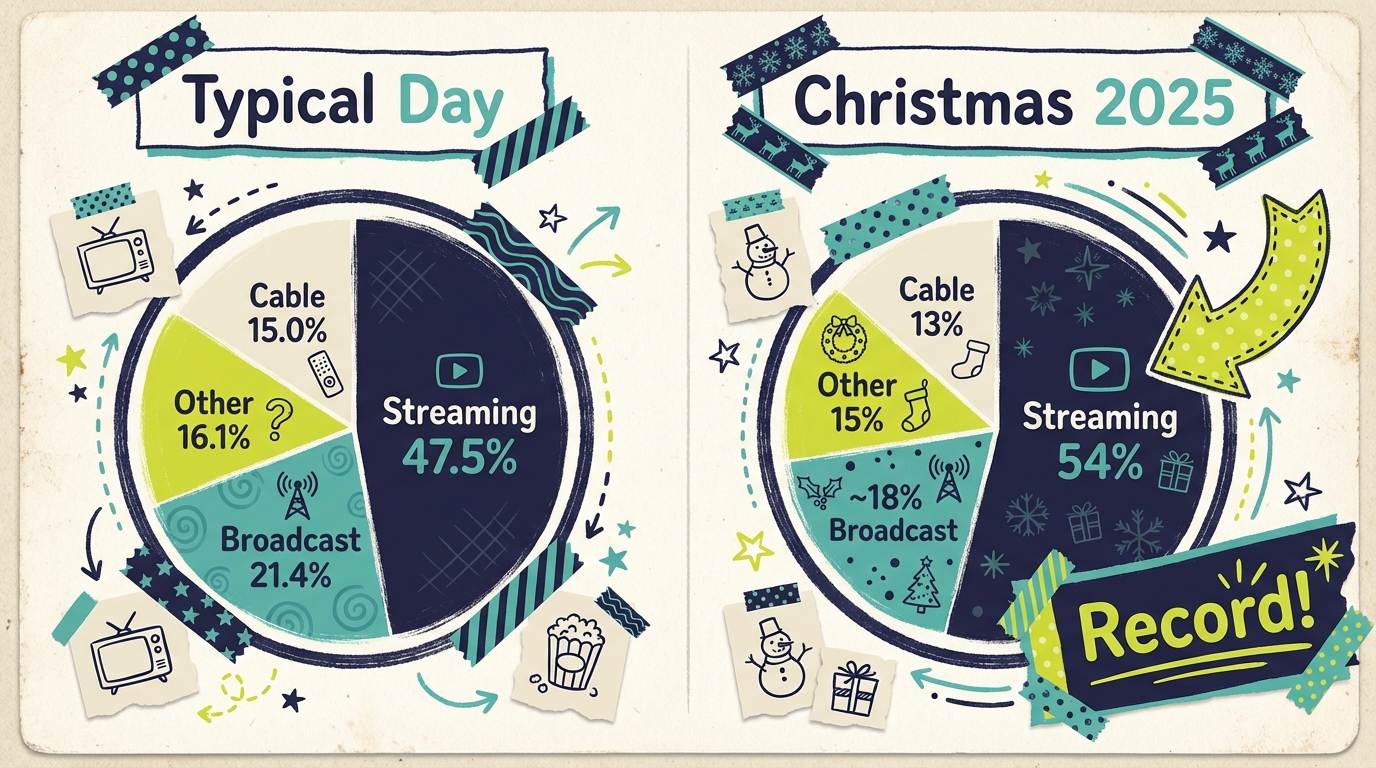
According to Nielsen's Gauge, here's how television viewing broke down in December 2025:
- Streaming: 47.5% (record high, up from 47.3% in July 2025)
- Broadcast: 21.4% (down from 23.2% in November 2025)
- Cable: 20.2% (continuing long-term decline)
- Other: 10.9% (gaming, DVD, etc.)
The November to December shift was notable. Broadcast dropped from 23.2% to 21.4%, a decline of 1.8 percentage points in a single month. November had seen broadcast benefit from the fall premiere season and NFL games on network television. December's decline reflects the seasonal shift as holiday content drove viewers to streaming platforms.
Year-over-year comparison
Comparing December 2025 to December 2024 shows streaming's continued gains at broadcast's expense:
The pattern is clear: streaming gains come primarily from cable, with broadcast declining more slowly. Cable's steeper decline reflects cord-cutting as households cancel subscriptions entirely. Broadcast, available free over the air, maintains a floor that cable lacks.
What performed well on broadcast
Despite overall decline, broadcast television still commands significant audiences for specific content. In December 2025:
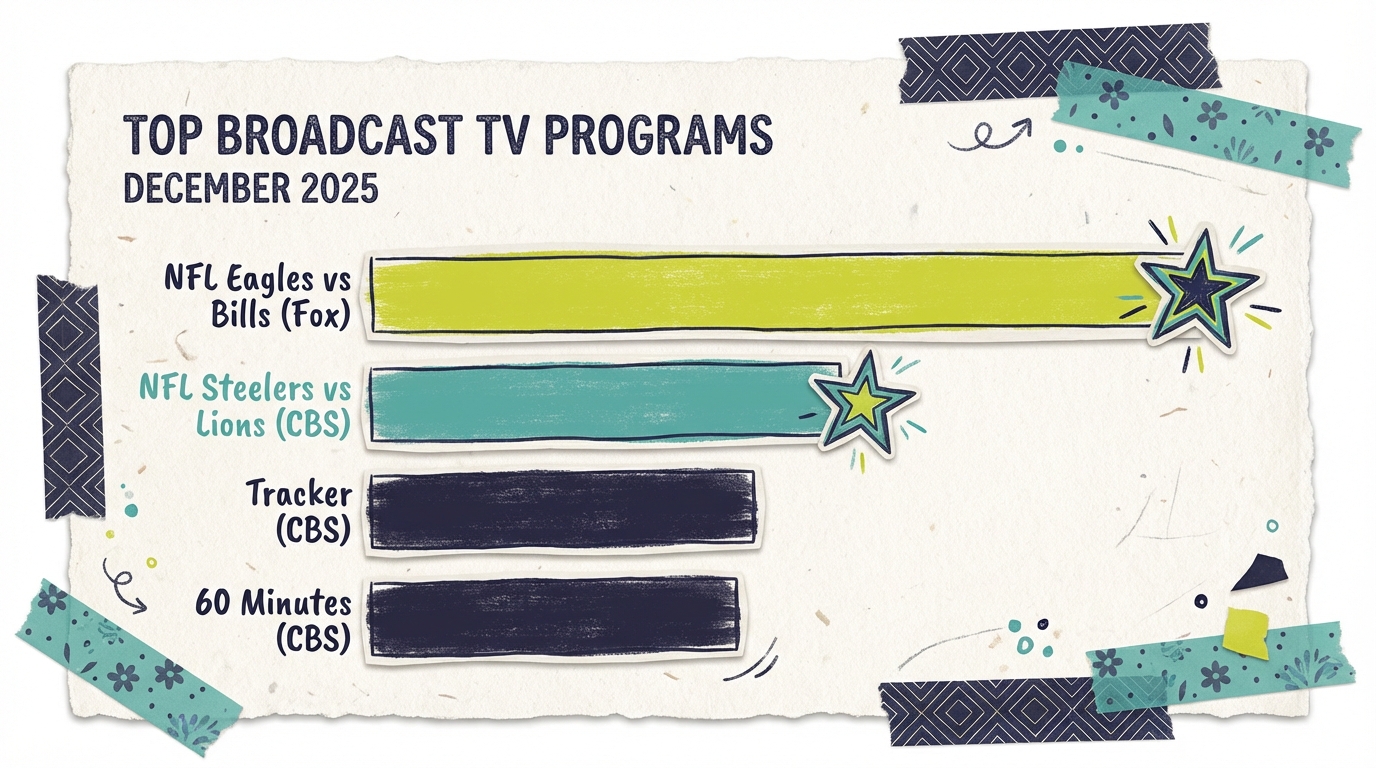
- FOX's Eagles vs Bills NFL game (December 28) was the top broadcast program
- CBS's Steelers vs Lions (December 21) ranked second
- Tracker on CBS exceeded 10 million viewers (L+7)
- 60 Minutes on CBS exceeded 10 million viewers (L+7)
Live sports and established procedural dramas continue to deliver broadcast's strongest audiences. These programs represent the core of broadcast's remaining value proposition.
---
Breaking down the numbers
Understanding broadcast's 21.4% share requires examining how that figure varies across demographics, time periods, and content categories.
By age group
The generational divide in broadcast viewing continues to widen. Among viewers 65 and older, broadcast television captures roughly 28-30% of their TV time, well above the overall average. This audience maintains strong viewing habits around nightly news, primetime dramas, and daytime programming.
The picture changes dramatically for younger demographics:
- 18-34: Broadcast captures less than 12% of TV viewing (streaming dominates at 60%+)
- 35-49: Broadcast sits around 16-18% of viewing
- 50-64: Broadcast captures approximately 22-24% of viewing
- 65+: Broadcast remains strongest at 28-30% of viewing
This age skew has significant implications for advertisers. The 18-49 demographic that advertisers traditionally prize has shifted more dramatically to streaming than the overall numbers suggest. The median viewer age for broadcast primetime programming continues to climb into the mid-50s across most networks.
By time of day
Broadcast viewing patterns follow predictable rhythms that differ from streaming's always-on availability:
Morning (6am-9am): Relatively strong broadcast performance driven by morning news programs on ABC (Good Morning America), CBS (CBS Mornings), and NBC (Today). This daypart captures a disproportionate share of broadcast's total viewing.
Daytime (9am-4pm): Mixed performance with game shows and soap operas competing against streaming's vast on-demand libraries. Broadcast generally underperforms during these hours among working-age adults.
Primetime (8pm-11pm): Broadcast's showcase window, with highest-quality original programming. Even so, broadcast's primetime share has declined substantially as streaming platforms release major content at midnight for immediate availability.
Late night (11pm-2am): Broadcast maintains moderate share through late-night talk shows, though streaming's on-demand nature has eroded appointment viewing for this content.
Christmas Day record
Christmas Day 2025 illustrated streaming's dominance during peak viewing periods. According to Nielsen, streaming captured 54% of all TV viewing on December 25, 2025, with 55.1 billion viewing minutes. This shattered the previous single-day streaming record by 8%.
Combined Netflix and Prime Video commanded 22.5% of total TV usage on Christmas Day alone. Broadcast's share dropped below 18% on that day as families gathered to watch streamed movies and shows.
---
Why it matters for your business
If you're considering television advertising, broadcast's 21.4% share means understanding both its limitations and its remaining strengths. The numbers tell a clear story, but the implications depend on your specific business goals.
When broadcast still makes sense
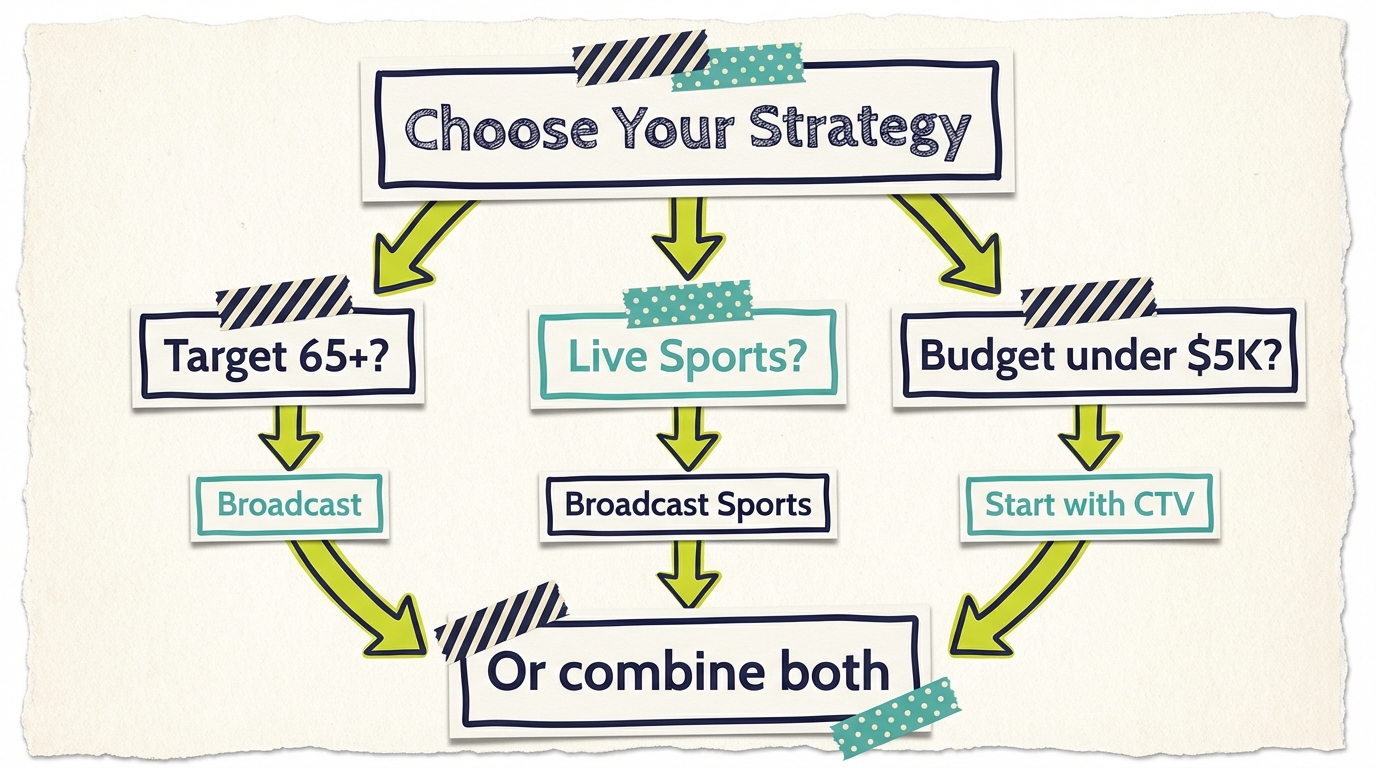
For businesses targeting older demographics, broadcast remains a viable option. The 65+ audience that still watches significant amounts of broadcast TV represents substantial purchasing power in categories like healthcare, financial services, insurance, and home improvement. If your customers skew older, broadcast's concentrated audience might be more efficient than piecing together reach across multiple streaming platforms.
Live sports also justify broadcast consideration. NFL games on CBS, NBC, and FOX consistently rank among the most-watched programs on any platform. The Super Bowl still draws over 100 million viewers annually. If your advertising strategy centers on mass-reach moments, broadcast sports remain valuable.
Local news represents another broadcast strength. Morning and evening newscasts maintain loyal audiences in most markets, and local businesses can often negotiate reasonable rates for these dayparts.
The accessibility revolution
What's changed dramatically is accessibility. Traditional broadcast advertising required substantial minimum commitments, agency relationships, and advance planning measured in weeks or months. That world still exists for direct national broadcast buys.
But CTV advertising has opened new paths to television audiences that bypass traditional gatekeepers. Platforms like Adwave allow small businesses to reach television viewers (including those watching broadcast content through streaming apps) starting at just $50. You don't need a $50,000 production budget because AI generates your commercial from your website. The same audience that broadcast once exclusively controlled is now accessible through multiple channels.
Cost comparison
For most small businesses, the math favors CTV. The combination of lower minimums, precise targeting, and no production requirements makes streaming platforms more accessible and often more cost-effective.
---
How to take advantage of this trend
Understanding that broadcast commands 21% of viewing is useful. Knowing how to allocate your advertising spend in response is what actually helps your business grow.
Think audience, not delivery method
The most practical approach is to focus on television audiences rather than television delivery methods. Your potential customers watch TV. Some watch broadcast, more watch streaming, many switch between both during a single evening. Rather than trying to buy broadcast specifically, focus on reaching TV viewers wherever they're watching.
CTV platforms aggregate streaming and connected TV inventory, letting you reach viewers across hundreds of channels and apps (including streaming versions of broadcast content) without negotiating with individual networks. A $100-200 test budget over two weeks gives you real data about how television advertising performs for your business.
Prioritize geographic targeting
For most local businesses, geographic targeting matters more than specific channel placement. If you run a plumbing company or dental practice, reaching households in your service area is far more important than whether your ad runs during CBS's primetime lineup or on a streaming app.
Modern CTV platforms offer precise geographic targeting down to zip codes. Broadcast can only approximate this through local station buys that still reach entire markets.
Consider a hybrid approach
If you do want to incorporate broadcast specifically, consider a complementary approach:
- Run consistent CTV campaigns for ongoing brand presence at efficient CPMs
- Add broadcast spots during specific high-value windows (local news, sports broadcasts)
- Track results separately to understand which channel delivers better ROI
This hybrid strategy captures broadcast's remaining mass-reach moments while maintaining cost-efficient streaming presence the rest of the time.
Measure appropriately
Television advertising works differently than performance marketing. You're not looking for immediate clicks. Instead:
- Watch for brand search lift (more people Googling your business name)
- Track overall website traffic during and after campaigns
- Use QR codes for direct response tracking
- Ask new customers how they heard about you
The key insight: broadcast's declining share doesn't mean television advertising is declining. Television viewing overall remains strong, with Americans watching over 4 hours daily on average. The viewing has simply redistributed across more platforms.
---
The bigger picture
Broadcast television's 21.4% share exists within a rapidly evolving media landscape. Understanding the broader context helps explain where things are heading.
Streaming dominance is structural
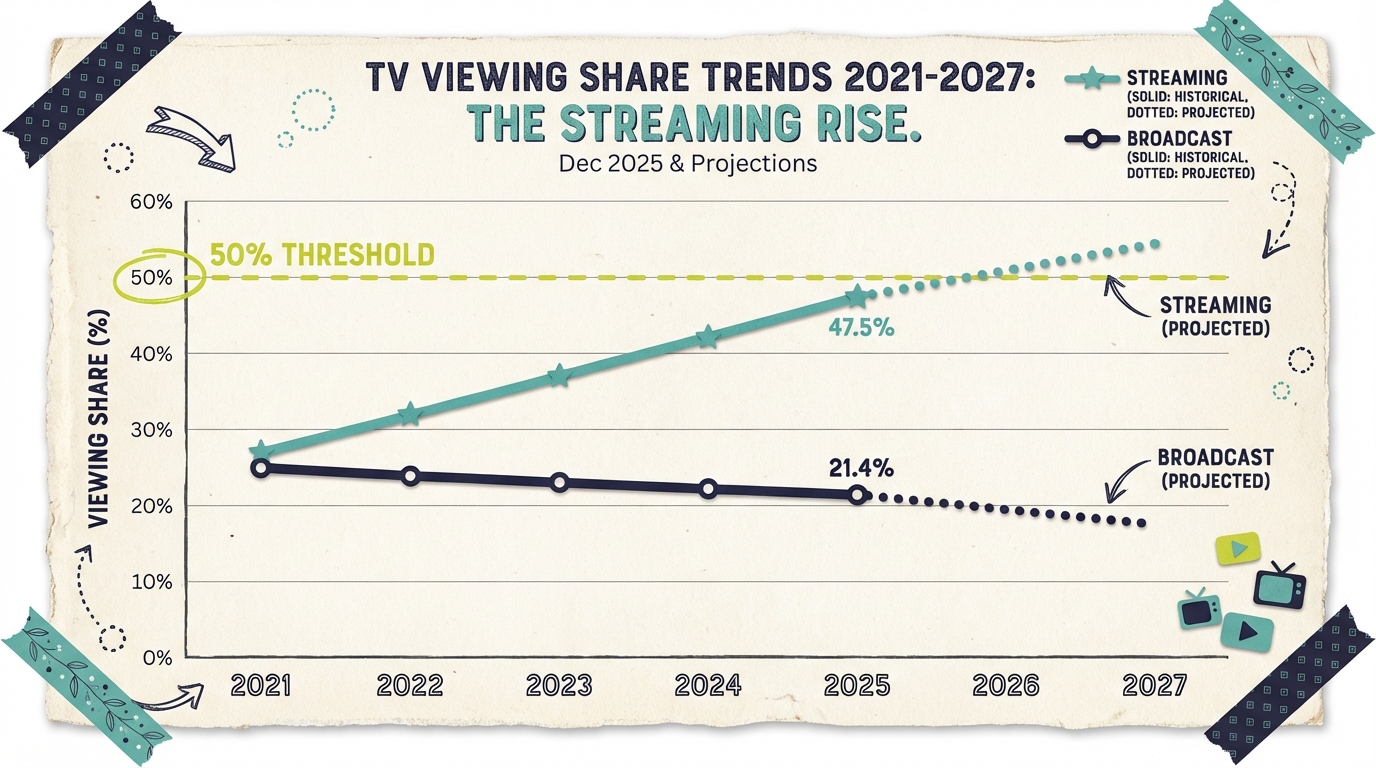
Streaming's 47.5% share in December 2025 represents a permanent shift, not a temporary trend. The category has grown consistently since Nielsen began tracking it in 2021, and industry analysts project continued gains through at least 2027.
Within streaming, ad-supported options have become increasingly dominant:
- YouTube: 12.7% of all TV viewing (larger than any broadcast network)
- Netflix ad tier: Over 70 million monthly active users
- Prime Video: 115+ million U.S. viewers seeing ads monthly
- FAST services: Tubi, Pluto TV, and Roku Channel combined exceed 8% of viewing
This shift has profound implications. Streaming inventory is largely programmatic, meaning it can be purchased efficiently through automated systems. Targeting capabilities exceed anything broadcast offers. And minimum budgets have dropped dramatically.
The 50% threshold approaches
Industry analysts project streaming will cross 50% of total TV viewing by mid-2026. December 2025 already saw two individual days exceed 50% (December 13 at 50.4% and Christmas Day at 54%). When streaming crosses 50% monthly, it will be the majority of television viewing, not just the largest category.
What's next for broadcast
Broadcast will likely continue losing share, though potentially at a slower rate than recent years. Networks are adapting by:
- Making content available on streaming platforms simultaneously
- Investing heavily in live events that don't travel well to on-demand viewing
- Embracing ad-supported streaming tiers for their content
- Acquiring or launching their own streaming services
The big four networks aren't disappearing. They retain valuable assets in live sports rights, established news operations, and legacy content libraries. But their dominance has definitively ended. For advertisers, this means treating broadcast as one option among many rather than the default choice it represented for decades.
---
What experts are saying
Industry analysts have noted December 2025's results as confirmation of accelerating trends.
Nielsen's Gauge report emphasized that "streaming shatters multiple records," noting that four streaming platforms achieved personal-best shares in the same month. The report highlighted Christmas Day's unprecedented 54% streaming share as evidence of changing viewing patterns during peak family time.
Industry observers at RBR noted that broadcast captured "less than 25% of December viewing," emphasizing the continued erosion of traditional television's position. The analysis highlighted that CBS and Fox dominated broadcast with NFL content, underscoring sports' importance to broadcast's remaining relevance.
Trade publications have emphasized the opportunity this shift creates for smaller advertisers. The combination of programmatic buying, AI-generated creative, and low minimum spends has effectively removed every traditional barrier to TV advertising for small businesses.
---
Common questions answered
What percentage of TV viewing is broadcast in 2025?
Broadcast television accounts for 21.4% of total U.S. TV viewing as of December 2025, according to Nielsen's Gauge. This represents a decline from November 2025's 23.2% share and continues the long-term downward trend from over 25% in 2021. Streaming now captures 47.5% of viewing, more than double broadcast's share.
How does broadcast compare to cable and streaming?
In December 2025, streaming led with 47.5% of TV viewing, followed by broadcast at 21.4% and cable at 20.2%. Streaming now captures more viewership than broadcast and cable combined. The gap continues to widen as streaming grows while traditional TV categories decline.
Why is broadcast TV viewing declining?
Broadcast viewing is declining because audiences are shifting to streaming platforms that offer on-demand content, broader selection, and personalized recommendations. Younger viewers especially have moved away from broadcast's appointment viewing model. While broadcast maintains strengths in live sports and news, general entertainment viewing has largely migrated to streaming.
Is broadcast TV advertising still worth it?
Broadcast advertising can be worthwhile for businesses targeting older demographics (65+) or seeking mass reach during live sports events. However, most small businesses will find CTV and streaming advertising more accessible and cost-effective. CTV offers lower minimums ($50 vs $2,000+), precise geographic targeting, and no production requirements.
Which broadcast network has the highest ratings?
No individual broadcast network consistently leads in overall ratings. CBS typically leads in total viewers due to older-skewing programming, while FOX often wins among younger demographics. In December 2025, FOX's NFL coverage (Eagles vs Bills) was the top broadcast program, while CBS dominated with the second-place NFL game and top non-sports shows Tracker and 60 Minutes.
Can small businesses afford broadcast TV advertising?
Local broadcast advertising typically requires minimum budgets of $2,000-5,000, plus production costs of $5,000 or more. National broadcast is largely inaccessible to small businesses. As an alternative, CTV platforms like Adwave offer access to television audiences starting at just $50, with AI-generated commercials eliminating production costs.
---
Supporting data
Key statistics on broadcast television viewing (December 2025):
- 21.4%: Broadcast share of total TV viewing (December 2025)
- 47.5%: Streaming share of total TV viewing (record high)
- 20.2%: Cable share of total TV viewing
- 54%: Streaming share on Christmas Day (single-day record)
- 55.1B: Streaming viewing minutes on Christmas Day
- 10M+: Viewers for Tracker and 60 Minutes on CBS
- -1.8 pts: Broadcast decline from November to December 2025
- $50: Minimum to start CTV advertising with Adwave
Data sources:
---
Get started with TV advertising
Ready to reach television viewers across broadcast, streaming, and everything in between? You don't have to choose just one platform.
Adwave makes TV advertising accessible for small businesses, with campaigns starting at just $50. Create a professional TV commercial in minutes using AI, then launch it across 100+ streaming channels including network content.
No production budget required. No agency needed. No minimum viewer age.
See how it works | View pricing
---
Statistics Boxes
Stat 1:
- Number: 21.4%
- Text: Broadcast share of U.S. TV viewing (Dec 2025)
Stat 2:
- Number: 47.5%
- Text: Streaming's record share (more than 2x broadcast)
Stat 3:
- Number: -1.8 pts
- Text: Broadcast decline from November to December
Version history
| Version | When | Summary |
|---|---|---|
| v1 | 6/20/2026, 3:11:54 AM | migration import |