Case Study: How a Local Retailer Drove Foot Traffic with Streaming TV
slug: local-retailer-foot-traffic-case-study · status: draft · score: 86% · 1 versions
View published version → · Contentful entry: 5aLFSdVEL0jzMFkUnUHYGp
Validation
| Rule | Detail | |
|---|---|---|
| pass | No banned competitors | No banned competitors |
| pass | No emdashes | No emdashes |
| warn | Avoid AI telltale words | AI telltale words found: leverage |
| pass | Primary keyword in title | No primary keyword to check |
| pass | Use contractions | Contractions used |
| warn | Minimum internal links | Only 1 internal links (minimum 3-5) |
| pass | FAQ section required | FAQ section present |
| fail | Author assigned | No author assigned (never use 'Adwave Team' for new content) |
| warn | Title length 50-60 | Title length 69 (aim 50-60 chars) |
| pass | Minimum 4 images | 4 images |
| pass | SEO description under 160 | seoDescription 154 chars |
| pass | Adwave mention cadence | 2 Adwave mentions |
| pass | Short description present | shortDescription 151 chars |
| pass | Word count by type | Word count 2262 within target |
| pass | Year-dated title for evergreen types | Type not year-dated |
| pass | No manual table of contents | No manual TOC |
Images (4)
Content
Case Study: How a Local Retailer Drove Foot Traffic with Streaming TV
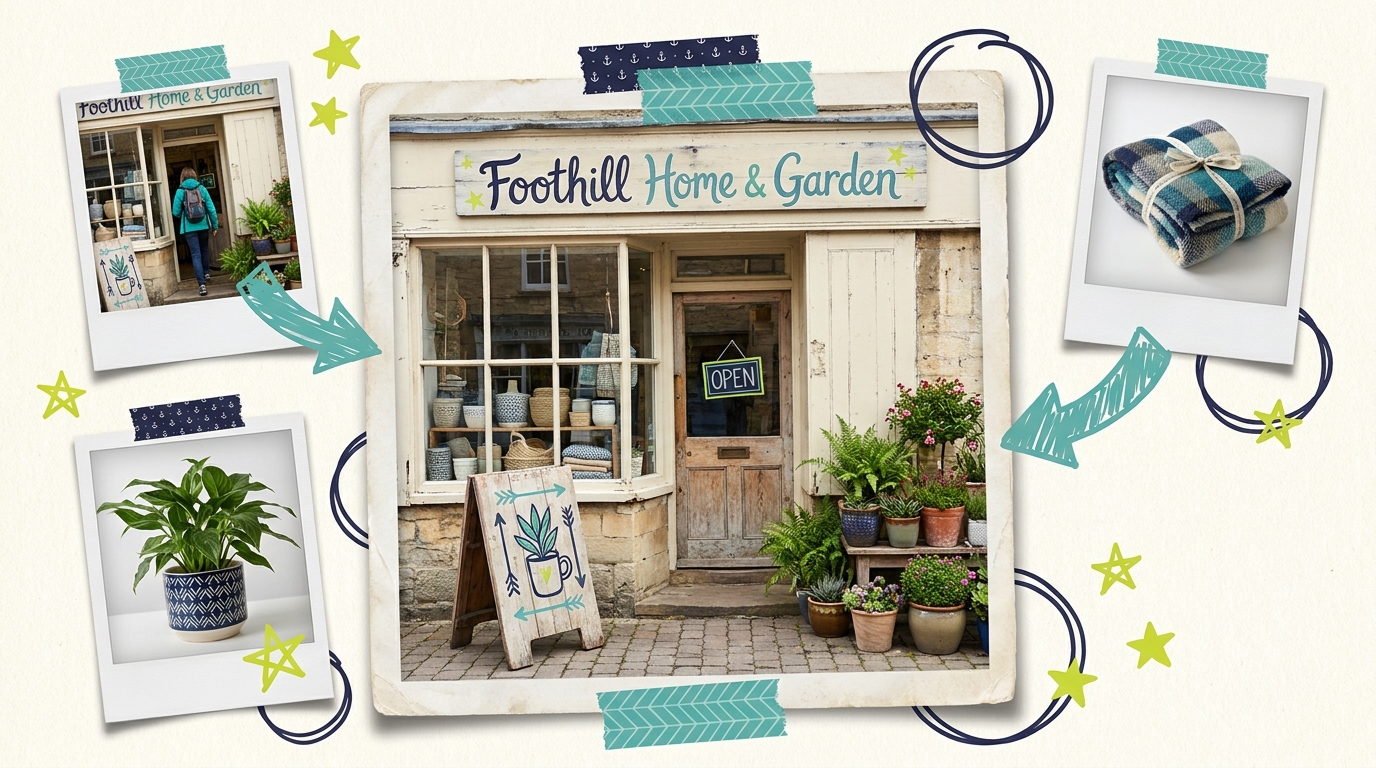
Foothill Home & Garden is an independent home goods store anchoring a strip mall in a mid-sized Southwestern metro. Six thousand square feet, twelve employees, a strong base of repeat customers, and the kind of curated assortment (small-brand kitchenware, indoor plants, handmade textiles) that doesn't show up at the big-box chains five miles down the road.
By late 2025, the store had a problem familiar to every independent retailer in 2026: traffic was flat. Their weekend customer count had been roughly the same for 18 months. Their email list was growing slowly. Their Meta campaigns produced strong post-engagement but didn't translate into walk-throughs of the door at the rate that would justify continued growth in spend.
The owners decided to test connected TV (CTV) over a 75-day window in early 2026. Here's what happened, what they learned, and what the numbers look like for a small independent retailer trying CTV for the first time.
The starting picture
Foothill's weekday foot traffic averaged around 110 visits. Saturday averaged 380. Sunday averaged 240. That's a typical pattern for a non-grocery local retailer: weekends drive most of the revenue, weekdays serve repeat customers and walk-ins.
Their existing marketing mix:
- Meta (Facebook + Instagram): $1,400/month
- Google (Search + local services): $900/month
- Email marketing: 4,200 active subscribers, weekly newsletter
- Local sponsorships: roughly $200/month in equivalent value (community board placements, neighborhood association)
Total monthly paid ad spend: $2,300. The store's annual revenue ran around $2.4M, with average ticket of $48 and an average customer making 3.2 purchases per year.
The owners' concern going in: CTV inventory had a reputation for being expensive, and most of the "CTV for small business" success stories they'd read featured service businesses, not retail. They weren't sure whether a 30-second TV spot would actually translate into someone driving over on a Saturday afternoon.
The success metric they agreed on going in: incremental weekend foot traffic over a 60-90 day window. Anything less than +15% weekend foot traffic would be considered a failed test.
The setup
The 75-day CTV campaign ran from late January through early April 2026. Total campaign budget: $1,800/month, or roughly $4,500 across the test window.
Three creative variations were produced using Adwave's AI creative tools:
- "Walk Through Our Store" spot. A 30-second tour-style spot showing actual shop interiors, plants, textiles, the front counter. Emotional and inviting, with a soft CTA: "Visit us this weekend at [address]."
- "Spring Refresh Is Here" spot. Timed for the spring re-set window (mid-February through March). Specific product callouts (planters, throws, seasonal kitchen pieces) with a slightly harder CTA: "Spring collection in store now."
- "Sunday Morning Special" spot. Specific to a recurring promotion the store ran (10% off Sunday mornings before 11 a.m.) with the most direct CTA: "Sundays before 11. Save 10% on everything."
Geographic targeting was set to a 7-mile radius around the store, plus three specific ZIPs slightly outside that radius where the store's loyalty data showed concentrated repeat-customer presence.
For attribution, the owners ran three tracking layers:
- A unique QR code printed on a small in-store sign reading "Saw us on TV? Show this for 10% off today" (giving them a hard count of TV-influenced visits)
- A weekly comparison of foot traffic against the prior 12-week pre-campaign baseline
- A "how did you find us?" question added to the email signup form at the register
What happened in weeks 1-4
The first month produced the kind of mixed-signal early data that often makes new CTV testers second-guess the channel.
A 6% weekend foot traffic lift was below the success metric, and only 23 customers were showing the QR code. The early temptation was to conclude TV wasn't working for retail. The owners held the campaign steady on the principle that 4 weeks isn't enough data to read CTV cleanly.
What changed their reading of the data was a conversation with their bookkeeper. The store's average ticket had quietly risen from $48 to $54.50 during the campaign weeks. That bump wasn't QR-driven; it was distributed across all customers. The team's hypothesis: TV was attracting customers who were primed to spend more (because they'd seen the curated assortment in the spot), and existing customers were spending slightly more too because the spot had reminded them why they liked the store in the first place.
The week 5 targeting adjustment
A few small adjustments were made in week 5 based on the dashboard data:
1. Tighter ZIP weighting. Geographic data showed two of the three outer ZIPs (added on the loyalty data hypothesis) were not converting at the same rate as the core radius. Those ZIPs were dropped, concentrating the impression budget on the core 7-mile area.
2. "Sunday Morning Special" daypart push. The Sunday-specific spot was getting limited delivery in the Saturday-evening window when most Sunday-decision-making happens. The team adjusted creative rotation to push that spot harder in Friday-evening and Saturday-morning slots.
3. Pause on the weakest creative. "Spring Refresh Is Here" had the lowest direct conversion signal. The team paused it and rotated the budget into the two stronger spots.
These adjustments did most of the work in the campaign's second half.
What happened in weeks 5-11
The second half of the campaign compounded the gains. Foot traffic momentum built progressively each week.
By the end of the 11-week run, the success metric (15% weekend foot traffic lift) was exceeded by a comfortable margin. More importantly, the weekday lift, which the team hadn't expected, was a meaningful share of total impact.
The cumulative numbers for the full 75-day test:
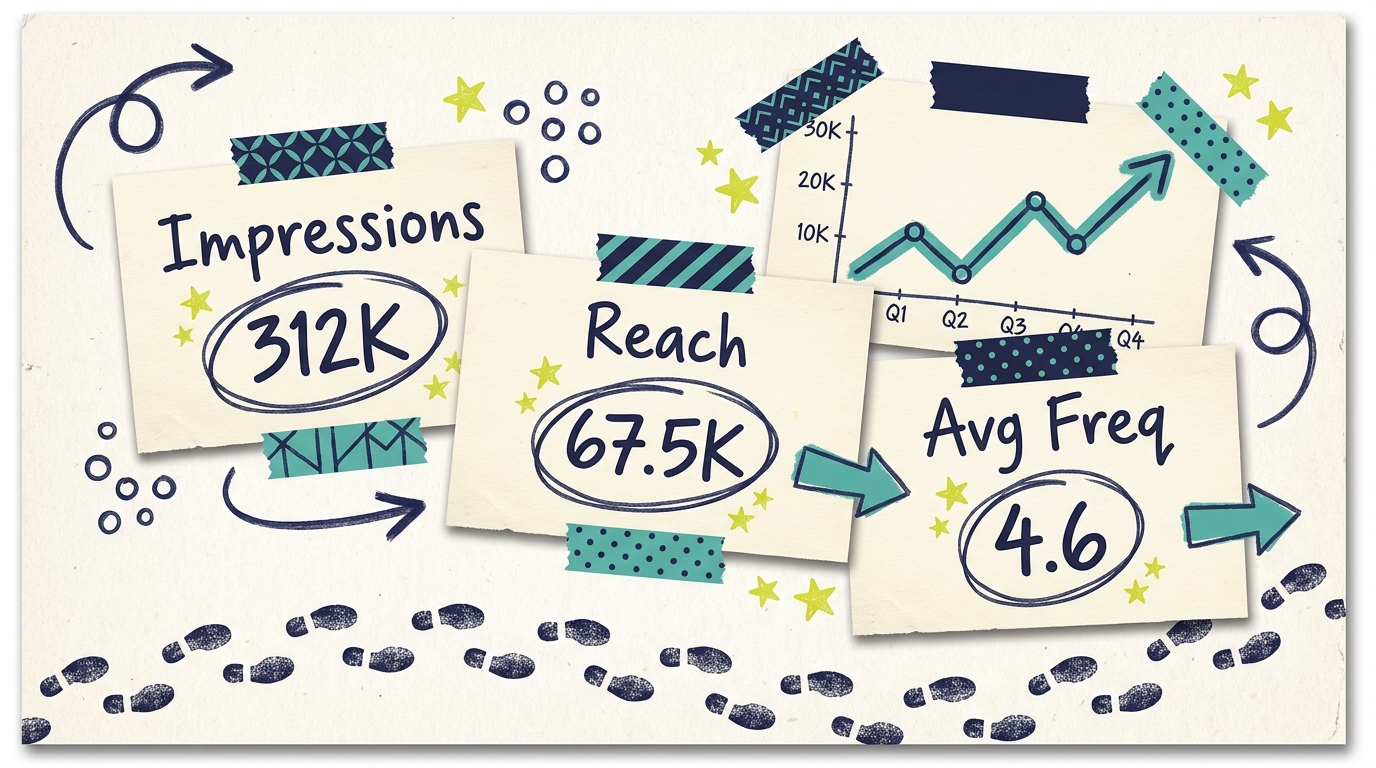
- Total impressions: 790,000
- Total reach: ~138,700 unique households
- Total spend: $4,950
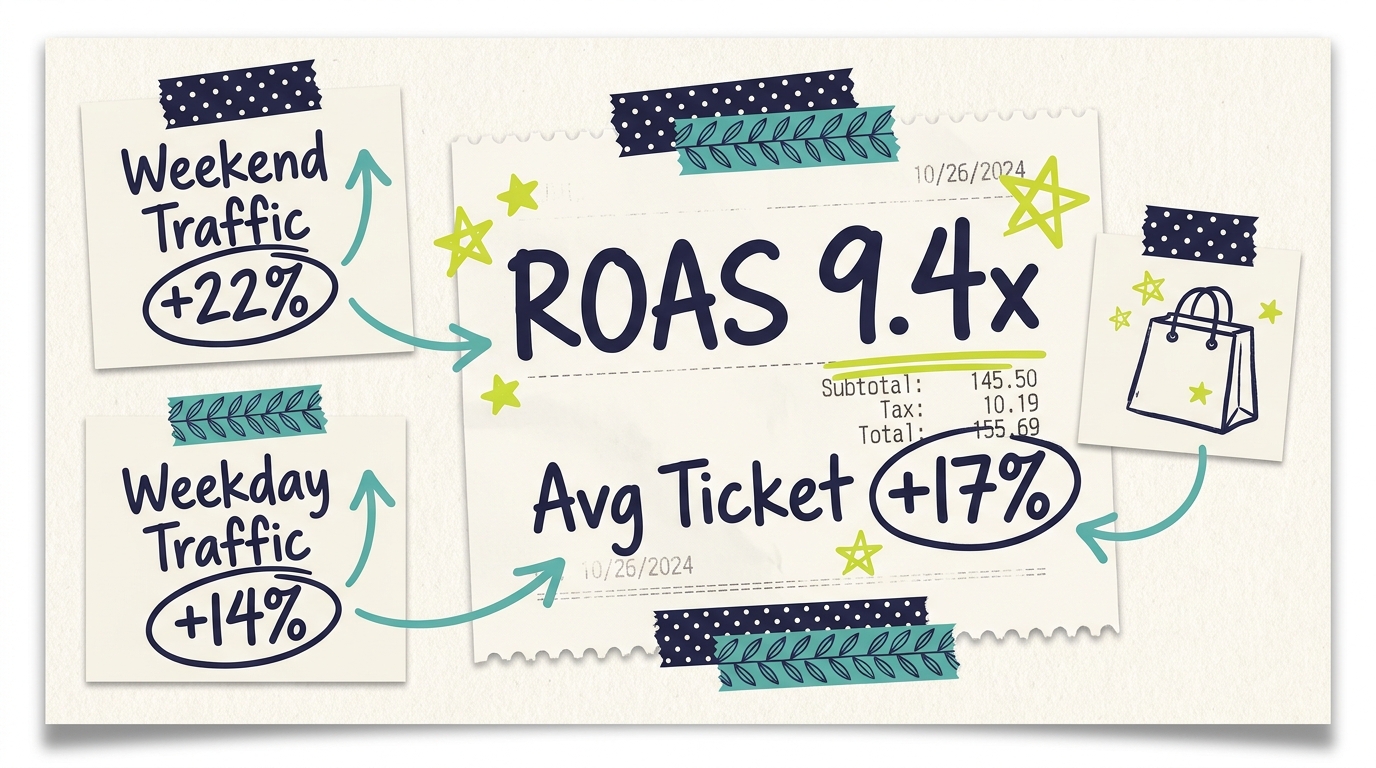
- Weekend foot traffic lift: +22% (about 95 extra weekend visits per week by the end of the period)
- Weekday foot traffic lift: +14% (about 15 extra weekday visits per day)
- Average ticket lift: +17% (from $48 to $56.20)
- Direct QR-attributed visits: 191
Translating to revenue
The revenue math is what made the owners' call: keep CTV in the permanent media mix.
Conservatively, the foot traffic lift produced approximately 825 incremental visits across the 75-day period. At the higher average ticket of $56.20, that's roughly $46,400 in incremental revenue. Against $4,950 in TV ad spend, that's a first-purchase ROAS of approximately 9.4x.
Lifetime ROAS is much higher. With an average customer making 3.2 purchases per year and the store's customer retention typically running multi-year for area residents, the lifetime value of those 825 incremental customers is approximately $580 each, or roughly $478,500 in lifetime revenue. Against the same $4,950 ad spend, that's a lifetime ROAS approaching 97x.
The average ticket lift is harder to attribute cleanly. Some of it is the "trust effect" (TV-warmed customers who shopped more confidently), some of it is the "spring re-set" creative driving toward higher-ticket product categories, and some of it is unrelated noise. Even conservatively crediting half the $8.20 average-ticket lift to the campaign, the value of that effect across all customers during the window is in the range of $24,000-$30,000 of additional revenue.
The honest picture: what didn't work
Several things didn't go as expected.
The "Spring Refresh Is Here" creative underperformed. It was the team's favorite going in. Direct conversion data showed it lagging the other two. The lesson: instinct about which creative will resonate is often wrong; the data corrects it.
Outer-radius ZIP targeting didn't pan out. The team's hypothesis that loyalty-customer-rich outer ZIPs would convert well wasn't supported. Concentrating budget in the core 7-mile area produced better results.
QR code attribution undercounted real impact. Only 191 QR scans in 75 days, but foot traffic lifted by approximately 825 visits over baseline. The QR captured about 23% of the true TV impact. Without the pre/post baseline measurement, the team would have concluded the campaign barely worked.
First-month signal was weak. The temptation to pull the campaign at the 30-day mark was real. Sticking with the original 75-day plan was what produced the result.
What this means for other independent retailers
A few patterns from Foothill's run that generalize to similar retailers:
CTV can work for retail at small budgets. $1,800/month is a real budget but not a punishing one for a $2.4M-revenue store. The economics worked out.
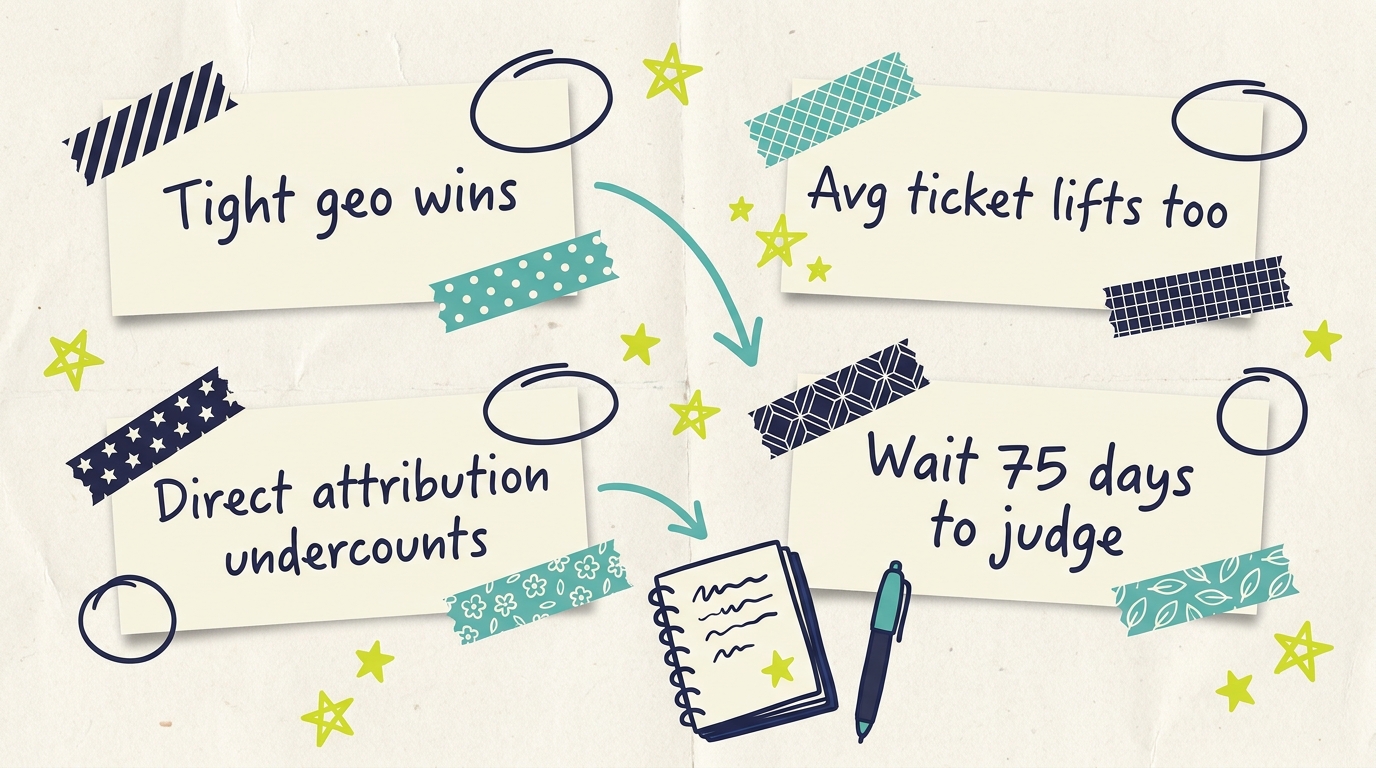
Tight geographic targeting matters most. The radius adjustment in week 5 unlocked most of the gains. Any retailer testing CTV should be ruthless about matching impressions to real drive radius.
Direct attribution will undercount. QR codes, vanity URLs, and intake questions capture a fraction of TV's real impact. Pre/post foot traffic baselines are essential for an honest read.
Average ticket lift is real. TV doesn't just bring more customers; it brings customers who spend slightly more on average. That secondary lift compounds the campaign's ROI meaningfully.
Plan for 75-90 day measurement windows. First-month signals will mislead. The clean read comes at the 75-90 day mark.
Common questions answered
How does a small retailer afford CTV advertising in 2026?
Subscription-tier platforms have made CTV accessible at $50-$500 entry points, with most independent retailers running tests in the $1,200-$2,500 monthly range. The 9.4x first-purchase ROAS Foothill achieved at $1,800/month is achievable for similar independent retailers, though specific results vary by category, geography, and competitive set.
Will CTV produce same-day foot traffic spikes?
Rarely. CTV's strength is building familiarity and trust that translates into customers choosing your store over alternatives when they're ready to shop. Day-of impulse visits do happen (especially with specific offer creative like Foothill's Sunday morning spot), but the majority of foot traffic lift comes from customers deciding to visit on their own schedule after multiple impressions.
Does CTV work for online-only retail, or just brick-and-mortar?
It works for both, with different attribution patterns. Brick-and-mortar attribution comes through foot traffic lift; online attribution comes through branded search lift, direct traffic, and cross-channel CTR improvement on Meta and Google. Online-only retailers measuring CTV should plan for cross-channel lift measurement rather than direct-attribution-only tracking.
Should an independent retailer cut Meta or Google when adding CTV?
Not during the test window. Hold Meta and Google steady for 75-90 days while testing CTV. The cross-channel lift CTV produces typically improves Meta and Google ROAS, which can be missed if you cut digital while adding TV. Rebalance after the test, not during it.
What's the most important creative decision for a retailer running CTV?
Showing actual store interiors and actual product assortments rather than generic stock-retail imagery. Local retail's competitive advantage is the curated, on-the-ground experience. Creative that highlights that experience builds the brand-specific recognition that drives the foot traffic. Generic creative builds awareness of "a store like that" without building awareness of your store specifically.
How quickly should a retailer expect to see foot traffic lift?
Modest signals (small lifts in weekend traffic, increased branded search) often appear in weeks 2-3. The full lift typically builds through weeks 4-8 and stabilizes by weeks 8-10. Foothill's 22% weekend lift was achieved by weeks 7-11. Retailers should plan for at least a 60-day window before evaluating performance, and ideally 75-90 days for a clean read.
What Foothill is doing next
The store has continued the campaign at $1,800/month as a permanent line item. Plans for 2026 include:
- Adding a fall-season creative (mid-September through mid-November) tied to their holiday assortment
- Testing a slightly higher monthly budget ($2,500/month) during their peak November-December window
- Pairing the CTV campaign with a community event in late September (sponsoring a neighborhood fall festival) to compound local recognition
- Building a referral-tracking layer in the loyalty program to better measure how TV influences existing customers' word-of-mouth
The owners' summary, when asked what they wished they'd known going in: "We almost cut the campaign at week 4 because the early signals were weak. The patience to let the 75 days play out was the most important decision we made."
What this means for your store
CTV is no longer a channel reserved for retail chains with large marketing teams. The combination of subscription-priced platforms, AI creative tools, and the trust-and-familiarity effects unique to TV make the channel one of the highest-leverage tests an independent retailer can run in 2026.
Ready to test what Foothill tested? Create your first ad with Adwave in about two minutes, target your service area, and build your own 75-day baseline starting this week.
Version history
| Version | When | Summary |
|---|---|---|
| v1 | 6/20/2026, 3:11:54 AM | migration import |