How Much TV Viewing Is Cable vs Streaming? (Q4 2025)
slug: cable-vs-streaming-viewing-share-q4-2025 · status: draft · score: 83% · 1 versions
View published version → · Contentful entry: 74jZr59vhvVi6WZs3PhYt2
Validation
| Rule | Detail | |
|---|---|---|
| pass | No banned competitors | No banned competitors |
| pass | No emdashes | No emdashes |
| pass | Avoid AI telltale words | No AI telltale words |
| pass | Primary keyword in title | No primary keyword to check |
| pass | Use contractions | Contractions used |
| fail | Minimum internal links | Internal links not in sitemap: /resources/tv-advertising-for-small-business, /how-it-works, /how-it-works, /pricing |
| pass | FAQ section required | FAQ section present |
| fail | Author assigned | No author assigned (never use 'Adwave Team' for new content) |
| pass | Title length 50-60 | Title length 52 |
| pass | Minimum 4 images | 5 images |
| warn | SEO description under 160 | seoDescription 165 chars (keep under 160) |
| pass | Adwave mention cadence | 4 Adwave mentions |
| pass | Short description present | shortDescription 112 chars |
| pass | Word count by type | Word count 2860 within target |
| warn | Year-dated title for evergreen types | Year-dated type should include (2026) in the title |
| pass | No manual table of contents | No manual TOC |
Images (5)
Content
How Much TV Viewing Is Cable vs Streaming? (Q4 2025)
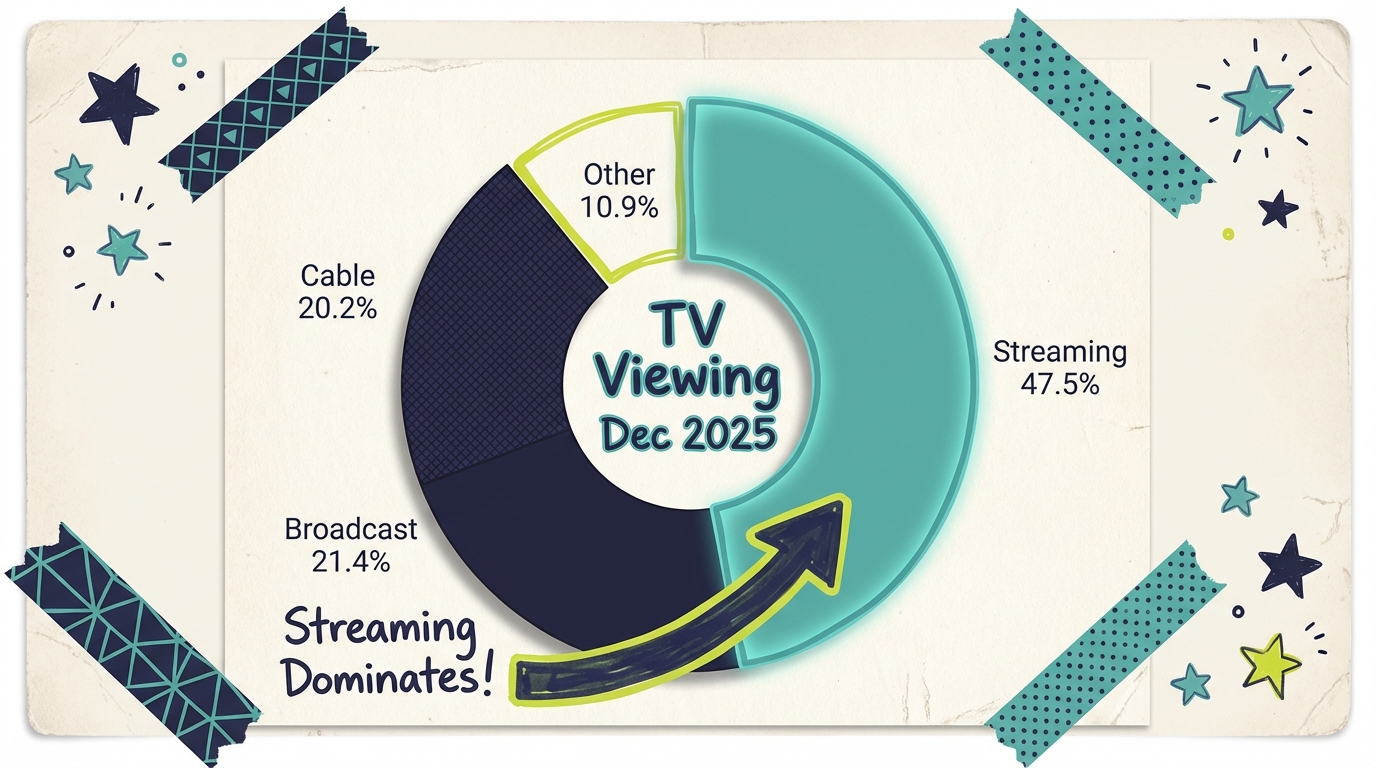
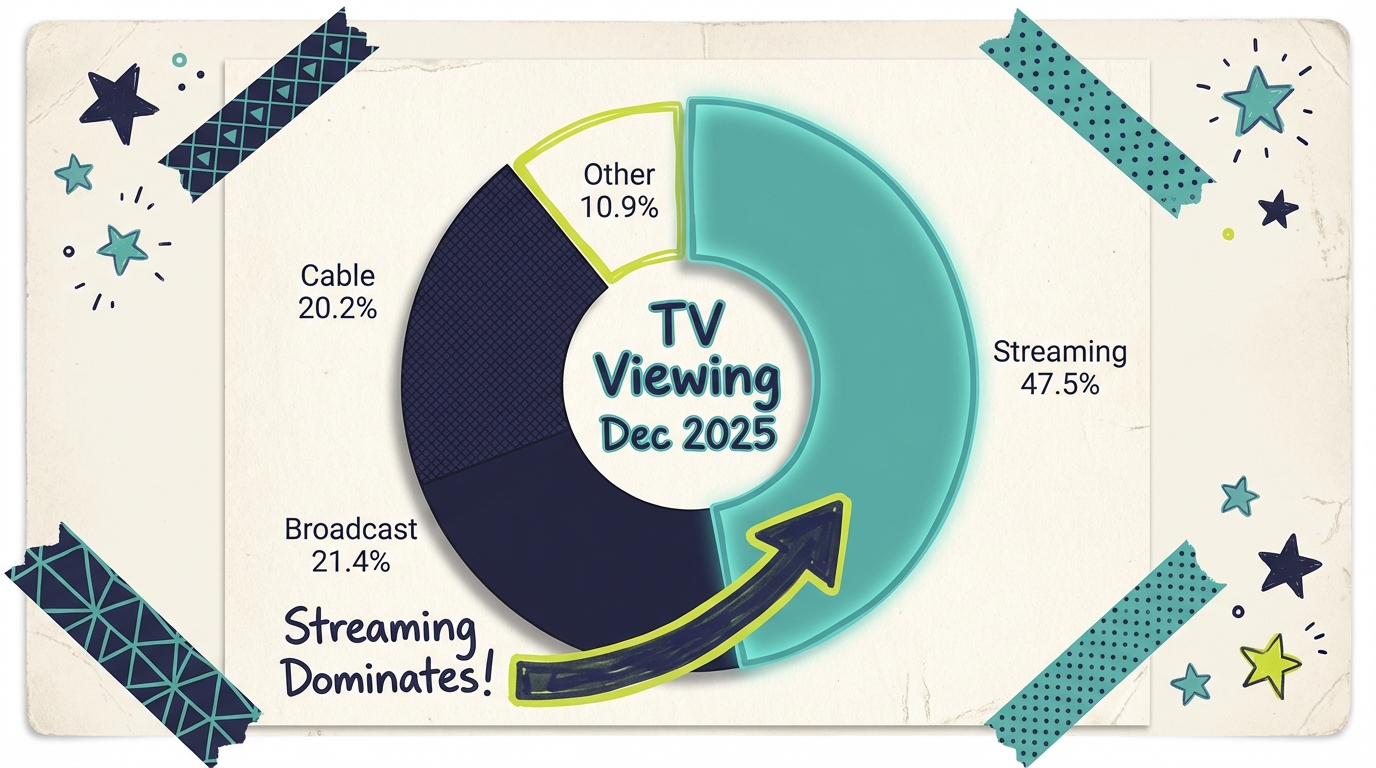
Streaming captured 47.5% of total U.S. TV viewing in December 2025, while cable dropped to just 20.2% and broadcast held at 21.4%, according to Nielsen's Gauge report. That means streaming alone now commands more viewing time than cable and broadcast combined (41.6%). The gap that seemed unthinkable just a few years ago has become a chasm. For advertisers still allocating budgets to cable, these numbers demand a serious rethinking of strategy. Here's what the December 2025 data reveals and what it means for businesses planning their advertising in 2026.
---
What the data shows
December 2025 delivered streaming's most dominant month ever, shattering records that had stood for just five months.
December 2025 viewing share breakdown
Based on Nielsen's Gauge data and industry reporting:
Streaming: 47.5% of total TV viewing
- Beat the previous record of 47.3% set in July 2025
- Largest share of TV ever reported in Nielsen's Gauge history
- Includes Netflix, YouTube, Hulu, Prime Video, Disney+, and dozens more
- Growing share month over month and year over year
Broadcast: 21.4% of total TV viewing
- Relatively stable compared to cable's decline
- NFL and holiday specials provided support
- Local and network news remain anchors
- Still skews older demographic
Cable: 20.2% of total TV viewing
- Lowest share in Nielsen Gauge history
- Down significantly from 24%+ just one year ago
- Sports and news remain strongest categories
- Continues steady, accelerating decline
Other (gaming, DVD, etc.): 10.9%
- Includes gaming console use on TV
- DVD and Blu-ray playback
- Other connected device usage
The Christmas Day record
December 25, 2025 rewrote the record books for streaming viewership. According to The Wrap's analysis:
- 55.1 billion viewing minutes on streaming platforms, shattering the previous record by 8%
- 54% of all TV viewing went to streaming, the highest single-day share ever recorded
- Netflix and Prime Video together commanded 22.5% of total TV usage on Christmas Day
- Second time in history that daily streaming exceeded 50 billion minutes
The first 50%+ day had occurred just 12 days earlier, on December 13, when streaming captured 50.4% of daily TV. Two 50%+ days in one month signals that streaming's dominance isn't a holiday anomaly but the new normal.
Year-over-year comparison
The acceleration from December 2024 to December 2025 is striking:
Streaming gained over 4 percentage points of share in a single year, almost entirely at cable's expense. Cable lost roughly the same amount streaming gained. Broadcast held relatively steady, protected by NFL football and holiday programming.
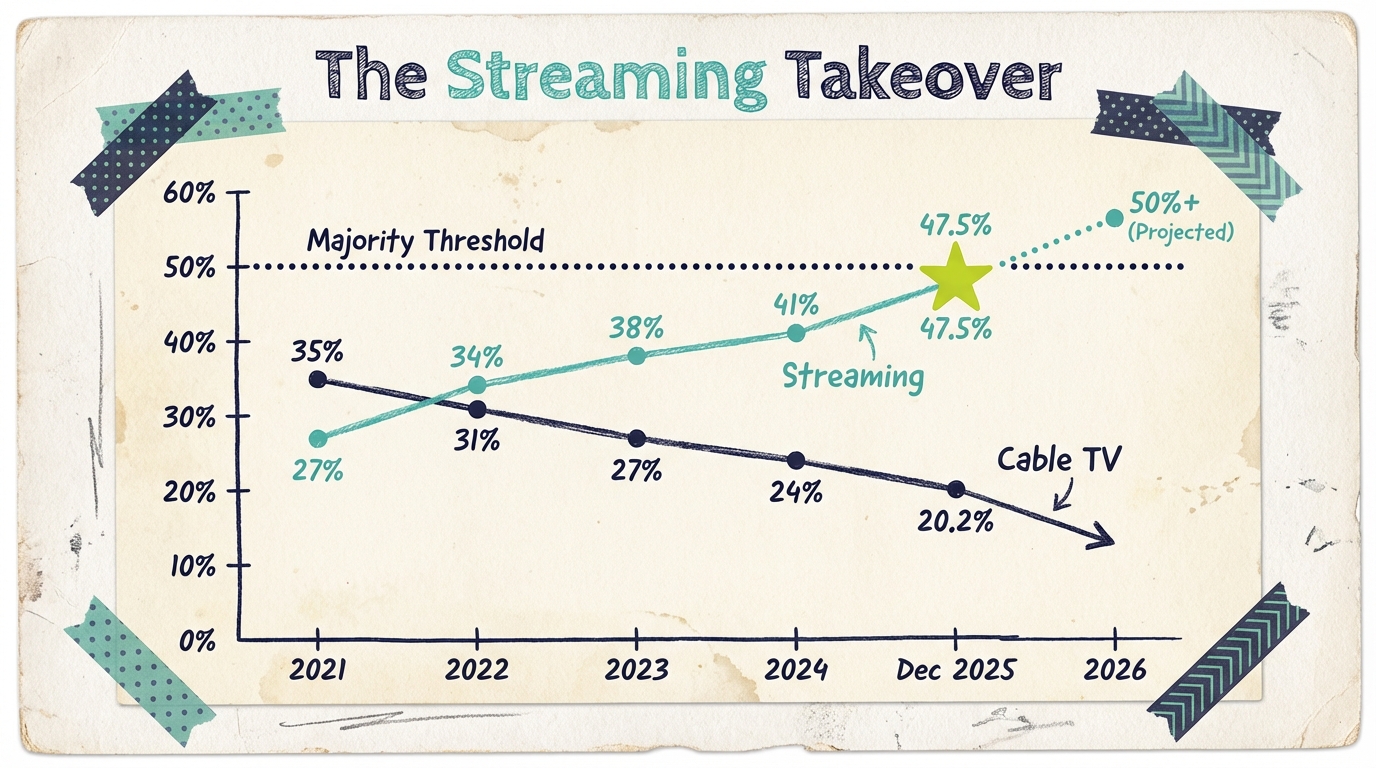
For context, streaming has gained approximately 20 percentage points of share since 2021, when it represented roughly 27% of TV viewing. Cable has lost about 15 percentage points over the same period.
Platform-level viewing shares
Within streaming, viewership concentrates on a handful of major platforms:
YouTube's 12.7% share alone exceeds cable's entire 20.2%. Netflix's 9% share represents nearly half of cable's total. The top two streaming platforms combined (21.7%) now exceed all of cable viewing.
---
Breaking down the numbers
Understanding who watches what helps advertisers make informed decisions about where to invest.
Demographics of cable vs. streaming viewers
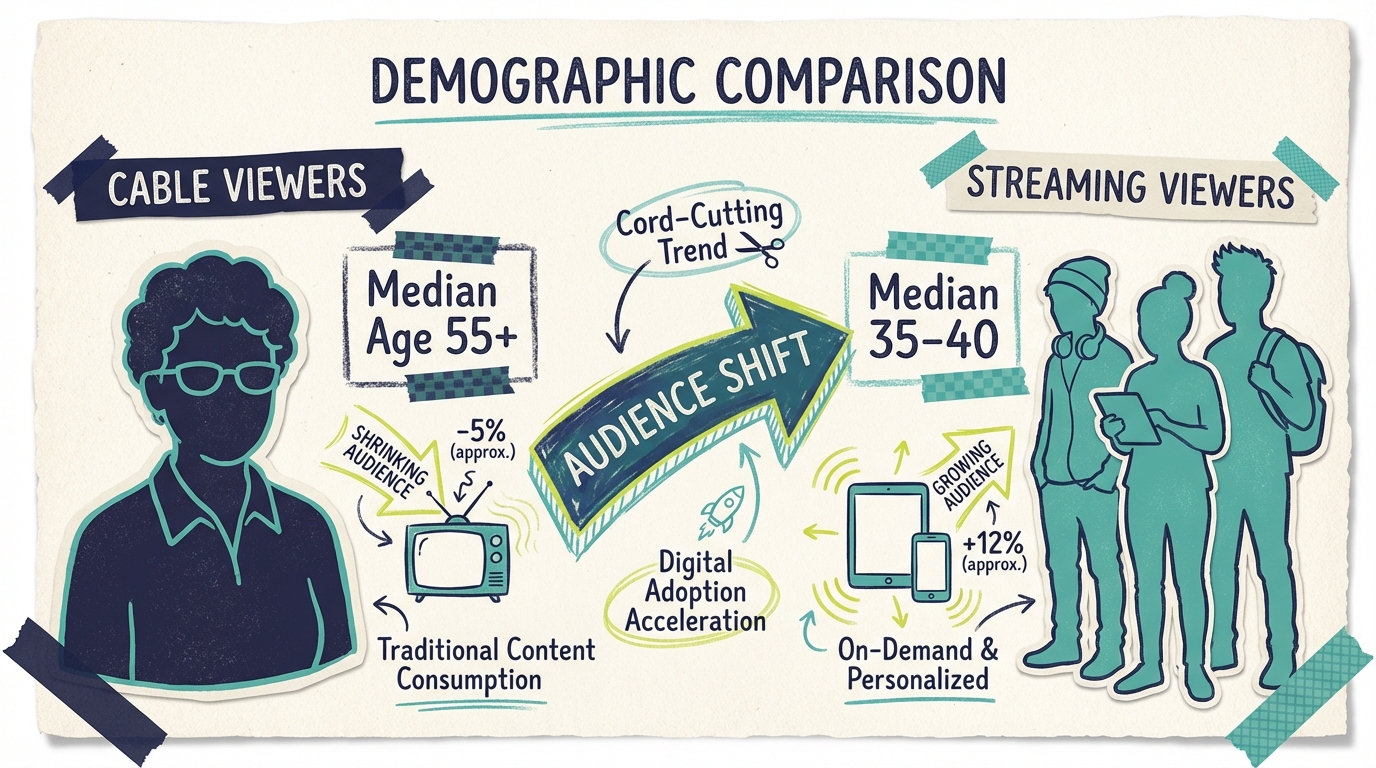
Cable viewers tend to be:
- Older (median age 55+)
- Often maintaining service for specific channels (ESPN, local news)
- Higher concentration in suburban and rural areas
- Declining in number each month as cord-cutting continues
Streaming viewers span all demographics but skew:
- Younger (median age 35-40)
- Higher adoption among urban and suburban households
- All income levels, with particularly strong penetration among higher incomes
- Growing as cord-cutters and cord-nevers become the majority
Broadcast viewers:
- Oldest demographic (median age 60+)
- Concentrated around major events (NFL, news, award shows)
- Strong local news viewership
- Over-the-air antenna users growing as an alternative to cable
The demographic implications are clear: if your target customer is under 50, streaming is where you'll find them. Cable's audience is not only smaller but older and continuing to shrink.
The streaming-first household
A growing majority of American households are now streaming-first or streaming-only:
- Cord-cutters: Former cable subscribers who cancelled, now ~35% of households
- Cord-nevers: Adults who never subscribed to cable, especially prevalent under 35
- Cord-shavers: Reduced cable packages supplemented with streaming
Together, these groups represent over half of American households. They cannot be reached through cable advertising at all. The only way to reach them on the TV screen is through streaming.
Viewing patterns by time of day
Prime time (8 PM - 11 PM):
- Streaming dominates decisively with 50%+ share
- Highest total viewing hours of the day
- Most valuable advertising inventory
Daytime (12 PM - 5 PM):
- Streaming competitive with cable
- Work-from-home viewers boost streaming
- Cable maintains some daytime programming audience
Morning (6 AM - 12 PM):
- Broadcast leads with morning news
- Cable news draws substantial audiences
- Streaming growing for background viewing
For advertisers, streaming's prime-time dominance is particularly significant. This is when the most viewers are watching and when advertising typically delivers the greatest impact.
---
Why it matters for your business
The 47.5% vs 20.2% split isn't just a statistic. It represents a fundamental shift in where advertising dollars should go.
The reach problem with cable
Cable advertising faces a compounding challenge:
Shrinking audience: Every month, more viewers leave cable. The 20.2% December share is down from 24%+ just one year ago and from 30%+ a few years before that.
Aging audience: Those who remain skew older. If you're targeting consumers under 50, cable reaches a smaller percentage of your audience each month.
Fragmentation: Cable's 20.2% share is spread across hundreds of channels. No single cable network commands significant individual share.
Rising effective costs: While cable CPMs remain lower than streaming, the shrinking audience means your cost per reached target customer is actually increasing.
The opportunity in streaming
Streaming advertising offers the inverse:
Growing audience: 47.5% and climbing. Your ads reach more potential customers as viewership grows.
Younger demographics: Access to audiences that cable simply cannot deliver.
Better targeting: Reach specific geographic areas, demographics, and interests rather than buying broad dayparts.
Accessible entry points: Streaming TV advertising starts at $50 on platforms like Adwave, compared to thousands for cable minimums.
Cost efficiency comparison
While cable's CPM appears lower, the total equation favors streaming. Paying $25 CPM to reach your exact target audience beats paying $10 CPM to reach a shrinking, older audience where most impressions are wasted.
---
How to take advantage of this trend
The data points to clear strategic implications for advertisers.
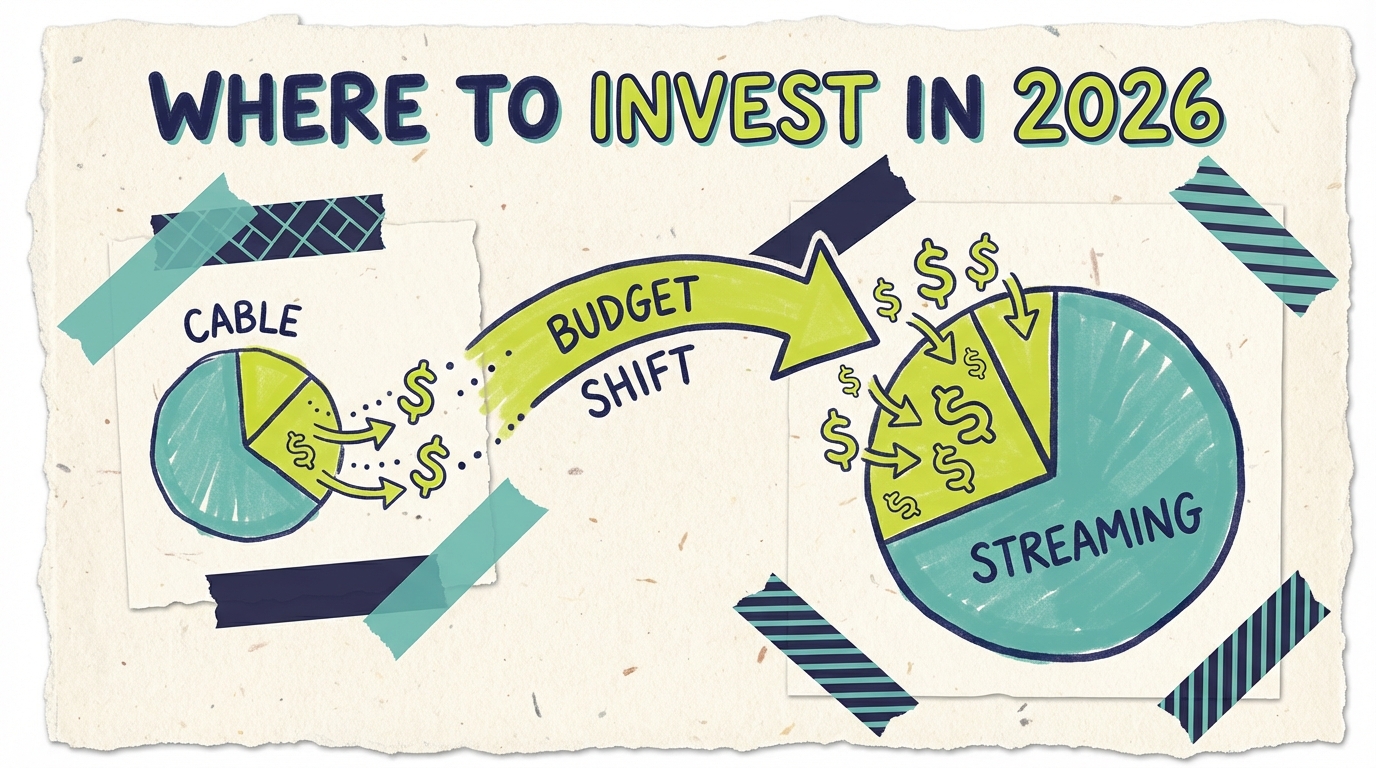
Strategy 1: Shift budget to streaming now
If you're still allocating significant budget to cable, the December data makes the case for reallocation:
- Start with 50-70% of TV budget on streaming
- Test performance against cable benchmarks
- Measure reach, frequency, and response metrics
- Shift more budget as streaming proves effective
For most businesses targeting consumers under 55, streaming should be the primary TV channel, not an afterthought.
Strategy 2: Use aggregated streaming platforms
Streaming's fragmentation (YouTube + Netflix + Disney + dozens more) creates complexity. Aggregated platforms solve this:
- Single campaign reaches multiple streaming services
- Unified reporting and optimization
- Access to inventory across the streaming ecosystem
- Often better CPMs than direct platform buys
Adwave provides access to 100+ premium streaming channels including inventory from all the major platforms, solving fragmentation with a single buy.
Strategy 3: Target the unreachables
Over half of American households have cut cable or never subscribed. These viewers are unreachable through cable advertising:
- Focus streaming campaigns on cord-cutter demographics
- Emphasize digital-native messaging
- Use streaming's geographic targeting to reach your specific market
- Accept that for many audiences, streaming is the only TV option
Strategy 4: Integrate with digital campaigns
Streaming TV works best as part of an integrated approach:
- Use streaming for awareness, digital for action
- Retarget streaming viewers with display and social
- Maintain consistent creative across channels
- Track lift across all touchpoints
Strategy 5: Time your campaigns strategically
Streaming viewership patterns suggest optimal timing:
- Prime time for maximum reach
- Weekends for household decision-makers together
- Seasonal moments (holidays, major events) for cultural relevance
- Year-round consistency for sustained awareness
---
The bigger picture
December 2025's 47.5% streaming share exists within a larger transformation that has been decades in the making but has accelerated dramatically.
The five-year trajectory
Streaming has gained 20 percentage points in five years. Cable has lost 15 points. The trajectory is clear and accelerating.
The 50% threshold approaches
Industry analysts project streaming will cross 50% of total TV viewing by mid-2026. Some predict it could happen as early as Q1 2026 given the momentum. December already saw two individual days exceed 50%.
When streaming crosses 50%, it will represent a psychological milestone: streaming will be the majority of television, not just the largest category. Cable and broadcast combined will be the minority.
What this means for 2026
For advertisers planning 2026 budgets, the December data suggests:
- Streaming-first strategies are now baseline, not innovative
- Cable budgets should be scrutinized and likely reduced
- Geographic targeting through streaming replaces DMA-based cable buys
- AI-powered creative eliminates production as a barrier
- Lower minimums make TV accessible to businesses of all sizes
The question is no longer whether to advertise on streaming but how much of your budget should go there. For most businesses, the answer is: most of it.
---
What experts are saying
Industry analysts have noted the significance of December's results.
Nielsen's Gauge report highlighted that "streaming shatters multiple records" and emphasized the historic nature of achieving 47.5% share. The research firm noted that four streaming platforms achieved personal-best shares in the same month.
Advanced Television's analysis observed that cable fell to "20.2% of total TV watch-time," marking continued erosion in what was once the dominant form of television distribution.
The Wrap reported that Christmas Day 2025 "shatters streaming record with 55.1 billion viewing minutes," emphasizing that the holiday period accelerated rather than paused streaming's momentum.
The consensus view is clear: streaming's dominance is permanent and growing. Advertisers who fail to adapt risk paying more to reach fewer people on cable while missing the growing majority of viewers on streaming.
---
Common questions answered
Is cable TV dead?
Cable isn't dead yet, but it's in sustained and accelerating decline. December's 20.2% share is the lowest ever recorded in Nielsen's Gauge, down from 24%+ just one year ago. Cable retains some strength in sports and news, but even those categories are shifting to streaming as platforms acquire rights. For advertisers, cable should be considered a secondary channel at best for most campaigns.
When will streaming reach 50% of TV viewing?
Based on current trajectory, streaming will likely cross 50% by mid-2026, possibly sooner. December 2025 already saw two individual days exceed 50% (December 13 at 50.4% and Christmas Day at 54%). The monthly average crossing 50% is a matter of when, not if.
Should I stop advertising on cable entirely?
Not necessarily, but you should evaluate whether cable still efficiently reaches your target audience. If you're targeting viewers over 55, some cable investment may still make sense. For most businesses targeting younger or broader audiences, shifting the majority of budget to streaming improves overall campaign efficiency. Test, measure, and adjust based on your specific results.
How does streaming advertising compare to cable advertising?
Streaming offers better targeting (ZIP code, demographic, behavioral), more flexible budgets (minimums as low as $50), and better measurement. Cable offers lower CPMs but declining reach and less precise targeting. For most small and medium businesses, streaming's targeting advantages outweigh cable's lower CPMs because you pay to reach only relevant audiences.
Can small businesses afford streaming TV advertising?
Yes. Platforms like Adwave make streaming TV advertising accessible starting at $50. AI-powered ad creation eliminates production costs. Geographic targeting ensures your budget reaches your specific market. Small businesses can now execute TV campaigns that deliver real results without cable's traditional barriers.
What percentage of TV viewing is streaming now?
As of December 2025, streaming represents 47.5% of total U.S. TV viewing, the highest ever recorded. Cable is at 20.2%, broadcast at 21.4%, and other sources at 10.9%. Streaming alone now exceeds cable and broadcast combined (41.6%).
---
Supporting data
Key statistics on cable vs. streaming viewing (December 2025):
- 47.5%: Streaming share of total TV viewing (record high)
- 20.2%: Cable share of total TV viewing (record low)
- 21.4%: Broadcast share of total TV viewing
- 54%: Streaming share on Christmas Day 2025 (single-day record)
- 55.1B: Viewing minutes on streaming Christmas Day (+8% YoY)
- 12.7%: YouTube's share of total TV viewing
- 9.0%: Netflix's share of total TV viewing
- +4.1 pts: Streaming share gain December 2024 to December 2025
- ~-4 pts: Cable share loss December 2024 to December 2025
- 50%+: Streaming share expected by mid-2026
Data sources:
- Nielsen Gauge December 2025
- Advanced Television Analysis
- The Wrap Christmas Day Report
- Nielsen Gauge December 2024
---
Get started with streaming TV advertising
The December 2025 data makes the case clear: streaming is where your customers watch TV, and it's where your advertising should be.
Adwave makes streaming TV advertising accessible for businesses of all sizes. Create a professional TV commercial in minutes with AI, target your specific market, and launch across 100+ premium streaming channels starting at just $50.
See how it works | View pricing
---
Statistics Boxes
Stat 1:
- Number: 47.5%
- Text: Streaming's share of total U.S. TV viewing
Stat 2:
- Number: 20.2%
- Text: Cable's share (record low)
Stat 3:
- Number: +4.1pts
- Text: Streaming gain year-over-year
---
Images
| Image | Filename | Type | Placement |
|---|---|---|---|
| Hero | hero.png | Pie chart | headerImage field |
| Body 1 | viewing-share-breakdown.png | Pie chart | After "What the data shows" |
| Body 2 | demographic-comparison.png | Comparison | After "Breaking down the numbers" |
| Body 3 | budget-allocation.png | Concept | After "Why it matters" |
| Body 4 | trajectory-projection.png | Line graph | After "The bigger picture" |
Version history
| Version | When | Summary |
|---|---|---|
| v1 | 6/20/2026, 3:11:54 AM | migration import |